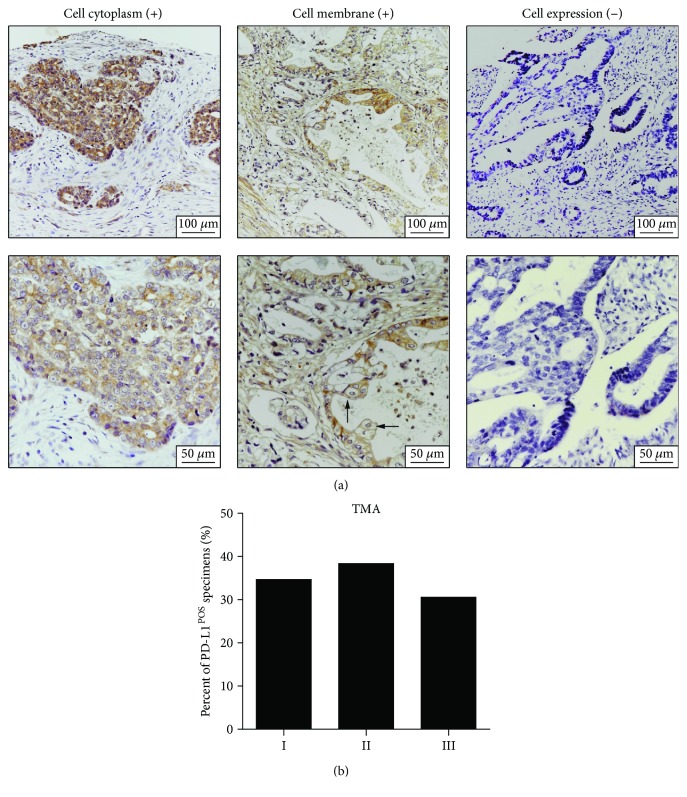
Figure 1.
PD-L1 expression in AGCs. (a) Representative samples of IHC staining of PD-L1, including tumor cell cytoplasm staining, tumor cell membrane staining, and negative control, are presented. The lower panel (400x original magnification) is the zoom-in image of the upper panel (200x original magnification). The arrows indicate the membrane PD-L1 expression in tumor cells. (b) The percent of tumor PD-L1-positive specimens in TNM stage I, II, and III GC patients.

