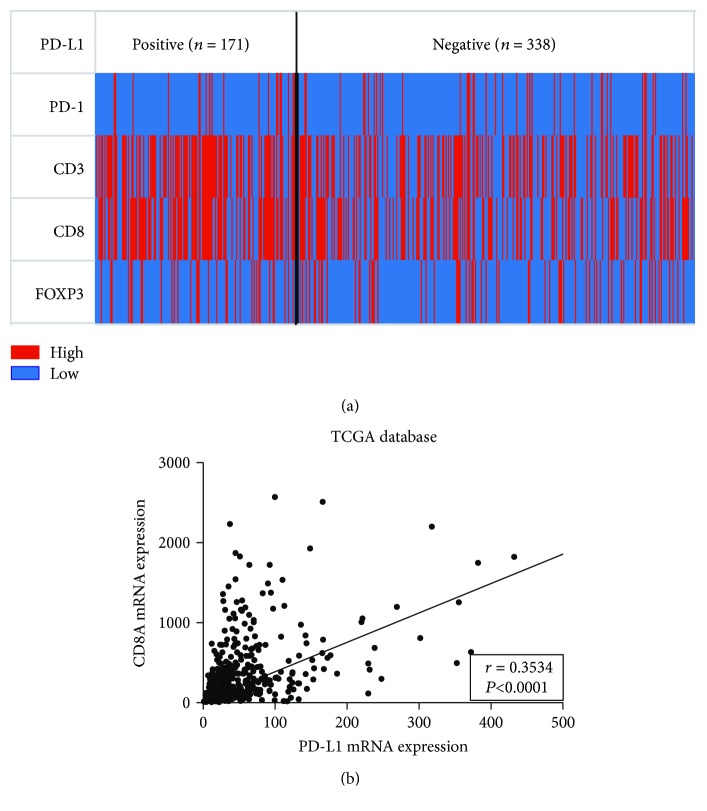
Figure 3.
The relationship between PD-L1 expression and T cell infiltration in 509 AGC patients and TCGA database. (a) The heat map of PD-1, CD3, CD8, and FOXP3 high and low infiltration in tumors of PD-L1-positive and -negative AGC patients. (b) The correlation between PD-L1 and CD8A mRNA expression levels in GC patients in the TCGA database.

