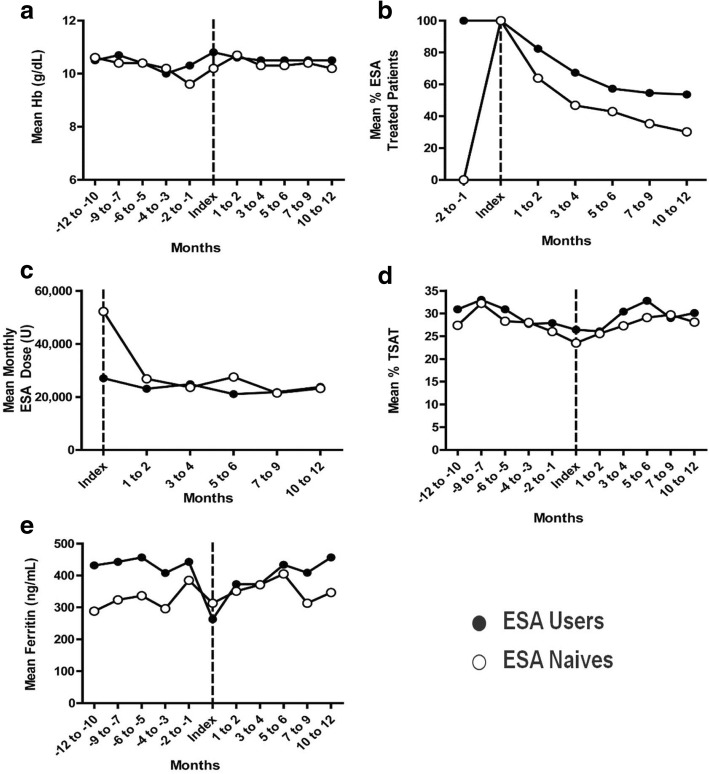
Fig. 2.
Longitudinal anemia measures and ESA use among baseline ESA users and ESA naives. Mean monthly hemoglobin (Hb) before and after index date (vertical dashed line) are shown in (a). Percentage of patients treated with ESA in each cohort is presented in (b) and the mean monthly ESA dose among users is shown in (c). Percent saturated transferrin (TSAT) (d) and serum ferritin (e) were measured to assess iron storage

