Fig. 1.

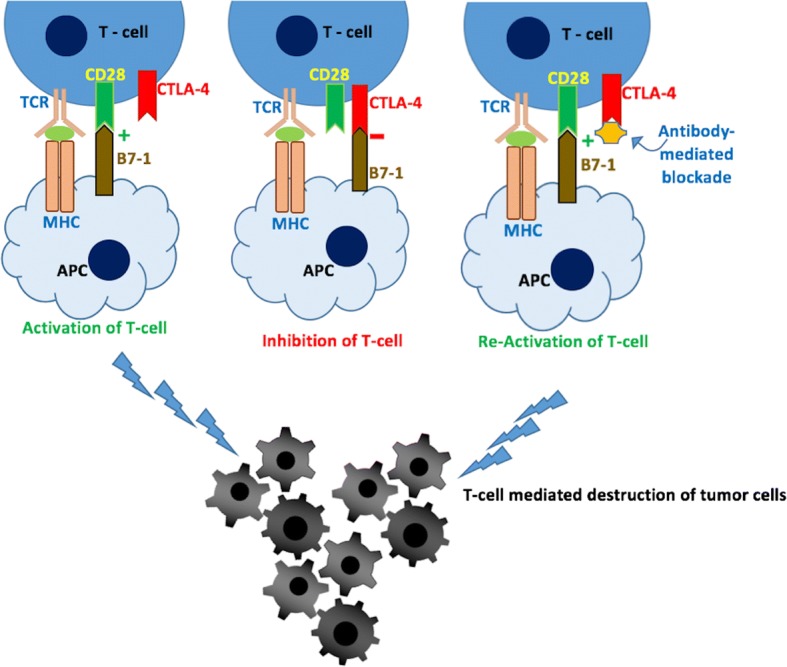
Schematic representation of T-cell activation and inhibition by the interactions of CD28 and CTLA-4 with the B7 ligands, B7–1 and B7–2, respectively

Schematic representation of T-cell activation and inhibition by the interactions of CD28 and CTLA-4 with the B7 ligands, B7–1 and B7–2, respectively