
Figure 2.
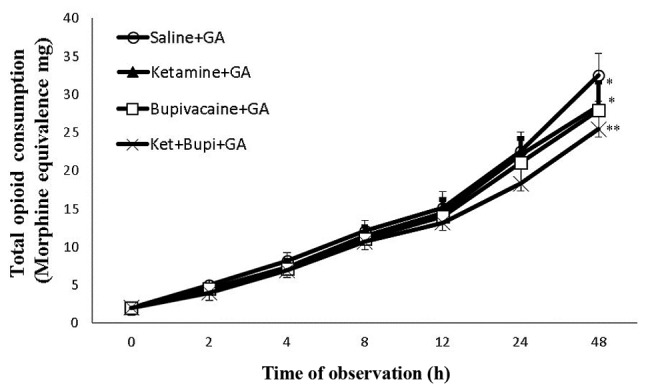
The total opioid consumption rate (morphine equivalence) of patients in each experimental group. Data are presented as the mean ± standard deviation. *P<0.05, **P<0.01 vs. saline+GA group. GA, general anesthesia; Ket+Bupi, ketamine and bupivacaine.