Figure 1.

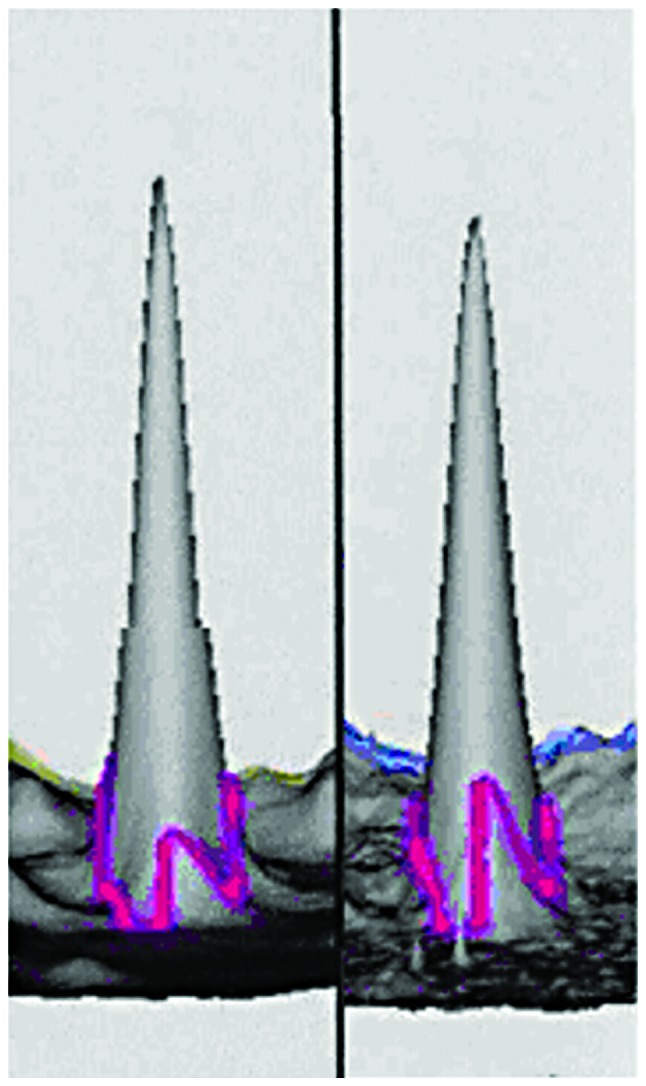
3D reconstructed image of haptoglobin in the GBS (left) and control (right) groups. The spot was upregulated in GBS 1.66 times compared to the control group (P<0.001). GBS, Guillain-Barré syndrome.

3D reconstructed image of haptoglobin in the GBS (left) and control (right) groups. The spot was upregulated in GBS 1.66 times compared to the control group (P<0.001). GBS, Guillain-Barré syndrome.