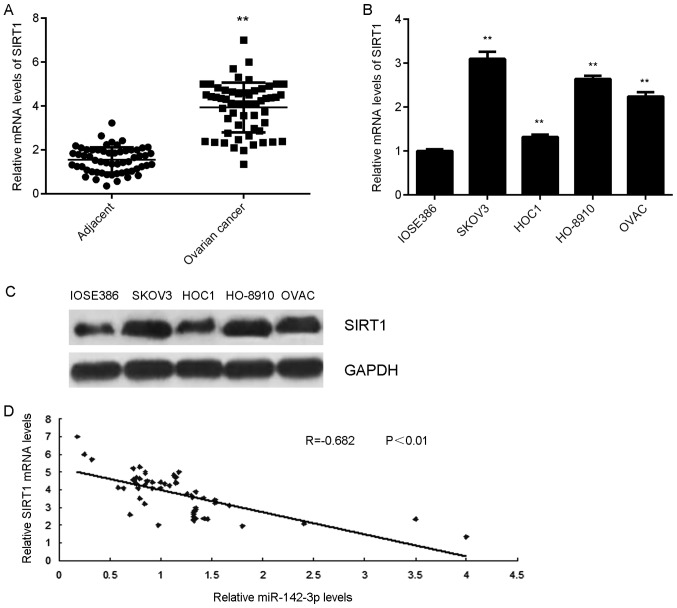
Figure 6.
SIRT1 expression in ovarian cancer. (A) RT-qPCR was used to analyze the mRNA expression levels of SIRT1 in ovarian cancer tissues compared with in matched adjacent non-tumor tissues. **P<0.01 vs. Adjacent tissues. (B) RT-qPCR and (C) western blotting were employed to examine the mRNA and protein expression levels of SIRT1 in ovarian cancer cell lines compared with in the normal human ovarian epithelial cell line IOSE386. **P<0.01 vs. IOSE386 cells. (D) A negative correlation between SIRT1 mRNA and miR-142-3p expression levels in ovarian cancer tissues was observed. miR, microRNA; RT-qPCR, reverse transcription-quantitative polymerase chain reaction; SIRT1, sirtuin 1.

