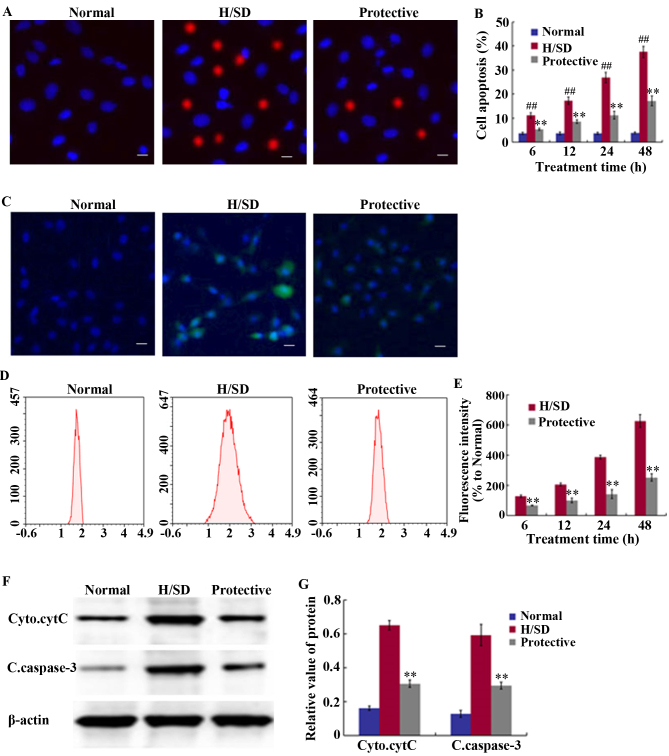
Figure 3.
Effect of HSYA on apoptosis levels and ROS generation in MSCs. (A) Determination of cell apoptosis through fluorescence staining procedures following exposure to H/SD treatment for 48 h (scale bar, 50 µm). (B) Quantitative MSC apoptosis levels at 6, 12, 24 and 48 h. (C) Determination of ROS accumulation through fluorescence staining following exposure to H/SD treatment for 48 h (scale bar, 50 µm), and (D) determination of DCF fluorescence intensity by FCM expressed relative to the normal control group following 6–48 h of H/SD treatment. (E) Quantitative ROS levels at 6, 12, 24 and 48 h. (F) Western blotting analysis of cytC and caspase-3 following 24 h of H/SD culture. (G) Quantification of relative band intensities. ##P<0.01 vs. the normal. **P<0.01 vs. the H/SD group. HSYA, hydroxysafflor yellow A; ROS, reactive oxygen species; MSCs, mesenchymal stem cells; H/SD, hypoxia and serum deprivation; FCM, flow cytometry; DCF, 2′,7′-dichlorodihydrofluorescein diacetate; Cyto.cytC, cytoplasmic cytochrome C; C.caspsase-3, cleaved caspase-3.

