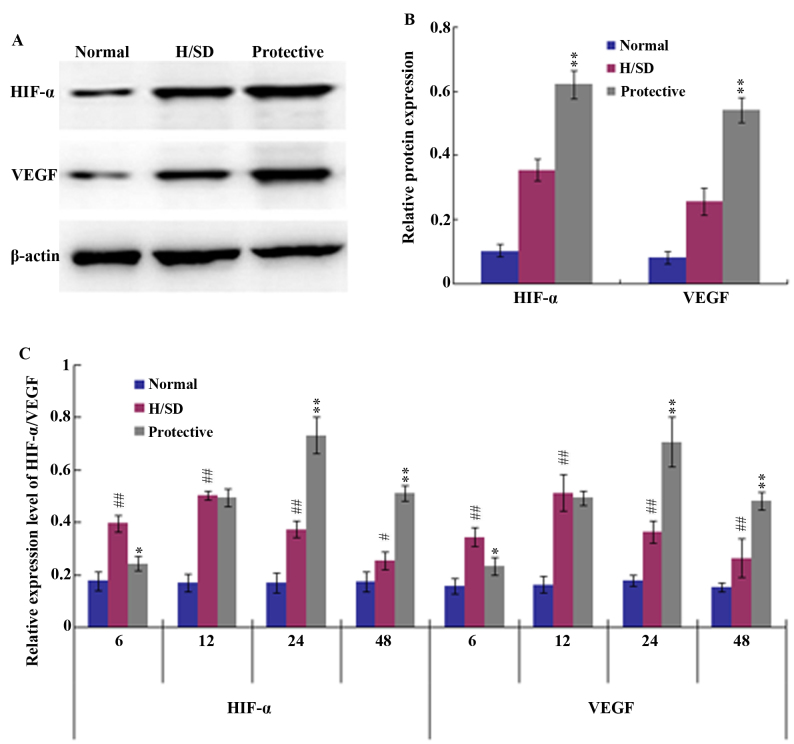
Figure 5.
Expression of HIF-α and VEGF through western blot and RT-qPCR analyses. (A) Western blotting analysis and (B) quantitative analysis of band densities revealed that following MSC culture under H/SD conditions for 24 h, 160 mg/l HSYA protection significantly increased the protein expression levels of HIF-α and VEGF. (C) RT-qPCR analysis demonstrated that HIF-α and VEGF mRNA levels were notably upregulated in HSYA protective group when compared with the normal and H/SD groups at 24 and 48 h of exposure. The results are presented as the mean ± standard deviation of three separate experiments. #P<0.05 and ##P<0.01 vs. the normal group. *P<0.05 and **P<0.01 vs. the H/SD group. HIF-α, hypoxia-inducible factor-α; VEGF, vascular endothelial growth factor; RT-qPCR, reverse transcription quantitative polymerase chain reaction; MSC, mesenchymal stem cells; H/SD, hypoxia and serum deprivation; HSYA, hydroxysafflor yellow A.

