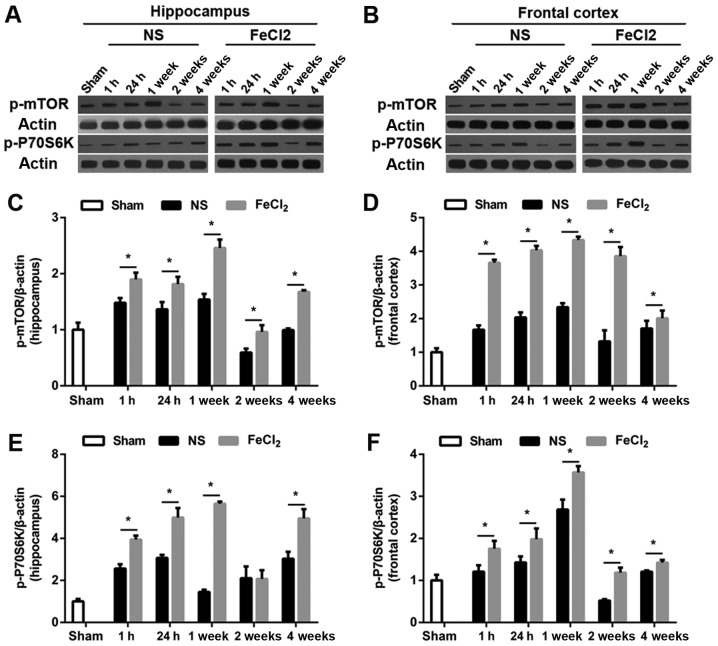
Figure 3.
Temporal course of p-mTOR and p-P70S6K expression in hippocampus and frontal cortex. (A and B) Representative western blot bands of p-mTOR and p-P70S6K expression. (C-F) Quantitative results of p-mTOR and p-P70S6K expression in hippocampus and frontal cortex. Values were shown as the fold changes compared with the sham group. N=6 per group. *P<0.05 vs. the NS-injected group. NS, normal saline; mTOR, mammalian target of rapamycin.

