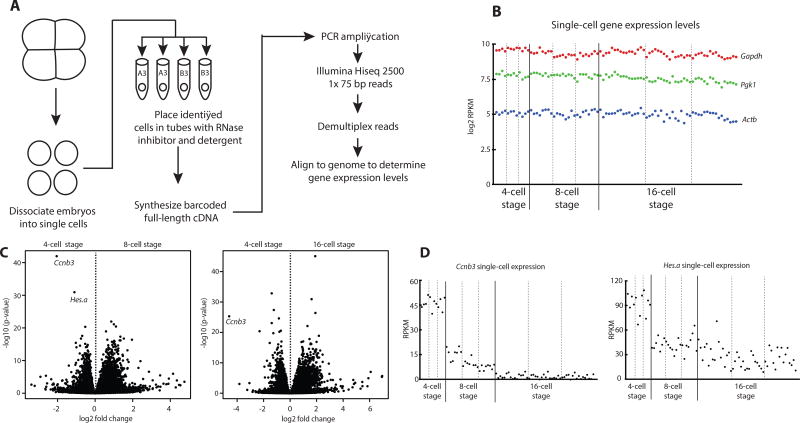
Figure 1. Single-cell resolution of Ciona early gene expression levels reveal Ccnb3 and Hes.a degradation coincides with the onset of zygotic transcription.
(A) Overview of the procedure used to isolate single-cell transcriptomes of Ciona embryos.
(B) Single-cell expression levels of Gapdh, Pgk1, and Actb. Each dot represents the gene expression levels of a single cell.
(C) Differential expression of all genes comparing cells at the 4-cell stage with the 8-cell stage and the 4-cell stage with the 16-cell stage.
(D) Single-cell expression levels of Ccnb3 and Hes.a. Cells from individual embryos are separated by dotted lines. See also Figure S1.

