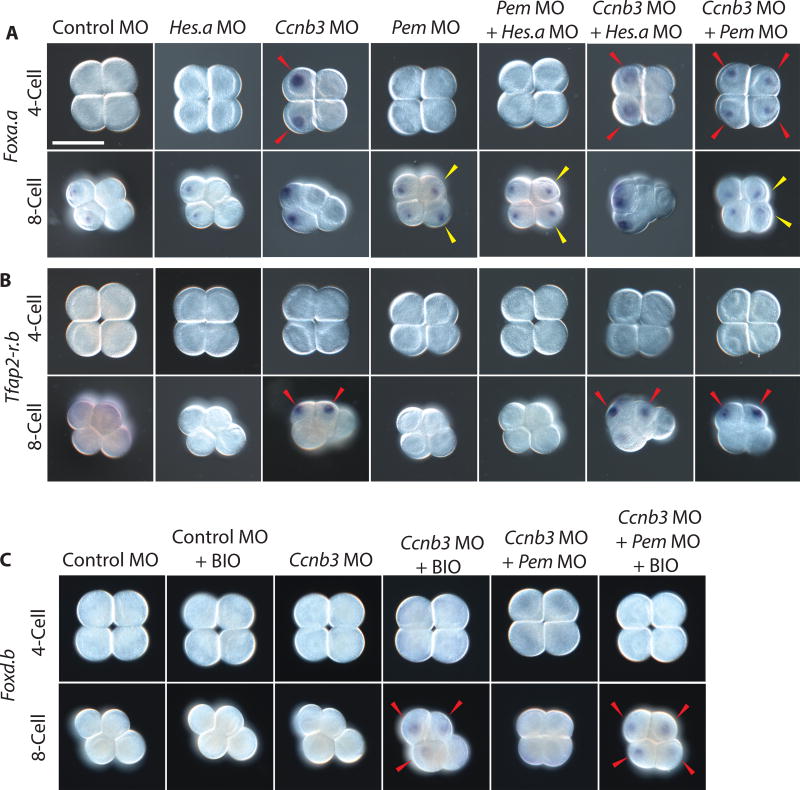
Figure 2. Ccnb3 knockdown results in precocious gene expression.
(A) In situ hybridizations of Foxa.a in early Ciona embryos injected with MOs targeting Hes.a, Ccnb3, and Pem individually or in combination.
(B) In situ hybridizations of Tfap2-r.b under the same experimental conditions as A.
(C) In situ hybridizations of Foxd.b with BIO treatments and Ccnb3 or Ccnb3 + Pem targeting MO injections. Expression in cells matching controls are indicated with a white arrowhead. The expansion of expression into additional cells is indicated with a yellow arrowhead. Precocious expression is indicated with a red arrowhead. Embryos are orientated anterior left. Scale bar = 50 µm. See also Figures S2–S3.

