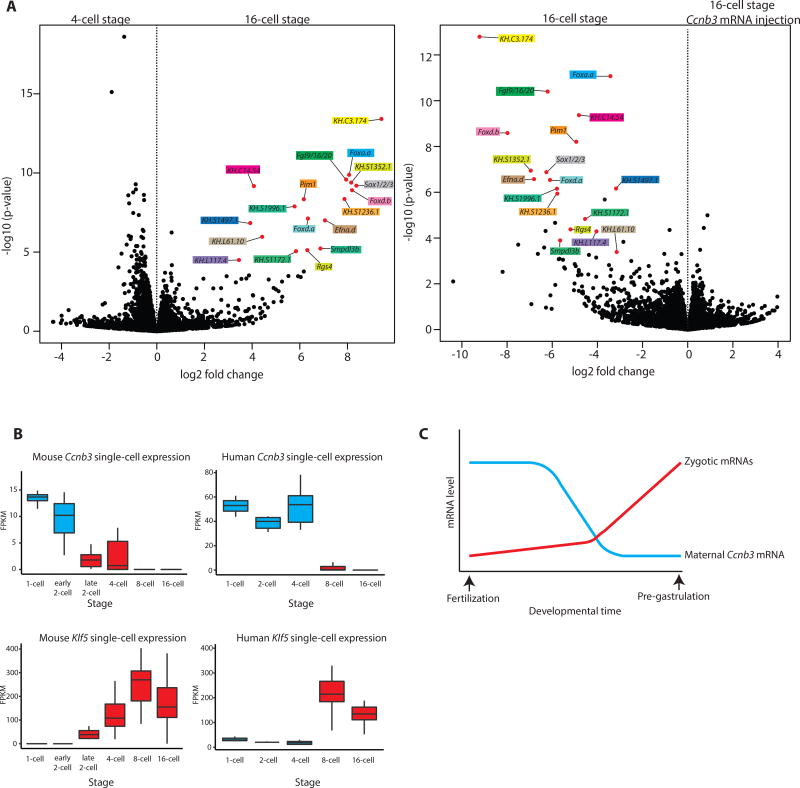
Figure 4. Ccnb3 depletion enables ZGA.
(A) Volcano plots depictions differential analysis of gene expression levels from RNA-seq of pooled Ciona embryo total RNA for the 4- vs 16-cell stage and for the 16-cell stage uninjected vs 16- cell stage Ccnb3 mRNA injection. Each stage and experimental condition was performed in biological triplicate (n=3) with embryos from different parent animals. Genes with an adjusted p-value of <0.1 for the 4 – vs 16- cell stage comparison are indicated by a red dot, named and color coded in both plots.
(B) Box plots of single-cell expression levels of Ccnb3 and Klf5 in early mouse and human embryos. Boxes indicates the lower (25%) and upper (75%) quantile and the solid line indicates the median. Whiskers extend to the 10th and 90th percentile of each distribution. Stages before the major onset of zygotic transcription are colored in blue, and stages after the major onset of zygotic transcription are colored in red.
(C) Overview of the relative levels of Cyclin B3 mRNA correlating with the onset of zygotic transcription. See also Figure S4 and Table S1.

