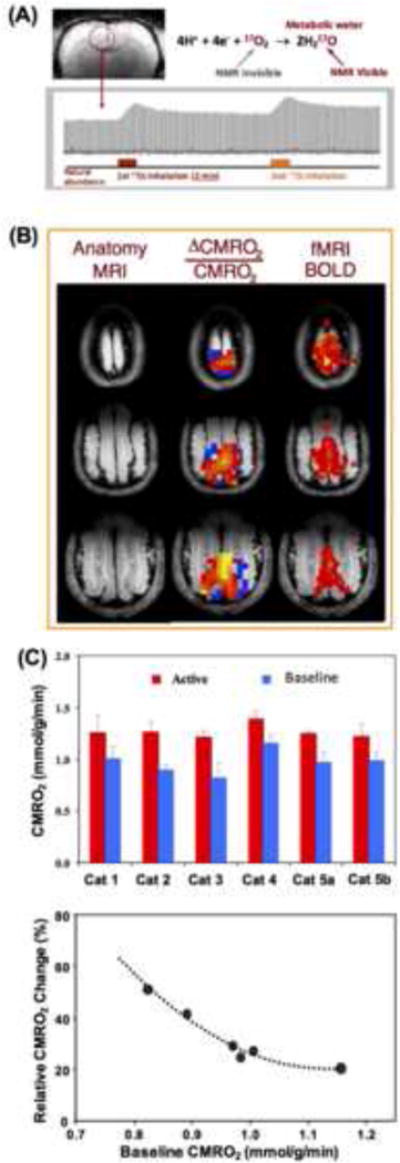
Fig. 5.

(A) Demonstration of single voxel time course of rat brain H217O signal and change taken from three-dimensional (3D) in vivo 17O MRSI measured before, during and after two inhalations of 17O2 for repeated CMRO2 and CBF imaging measurements. Adapted from the reference of Zhu et. al. [53]. (B) 3D functional CMRO2 activation maps (middle column) obtained from cat visual cortex showing relative increases of CMRO2 elevated by visual stimulation from a representative animal. The corresponding fMRI BOLD maps and anatomic brain images are also shown in the right and left column, respectively. (C) Summary (top panel) of baseline and activated CMRO2 in the visual cortex from five cats (repeated two studies from Cat 5), and the dependence between the baseline CMRO2 level and evoked CMRO2 percent change, indicating a negative correlation. Adapted from the reference of Zhu et. al. [54].
