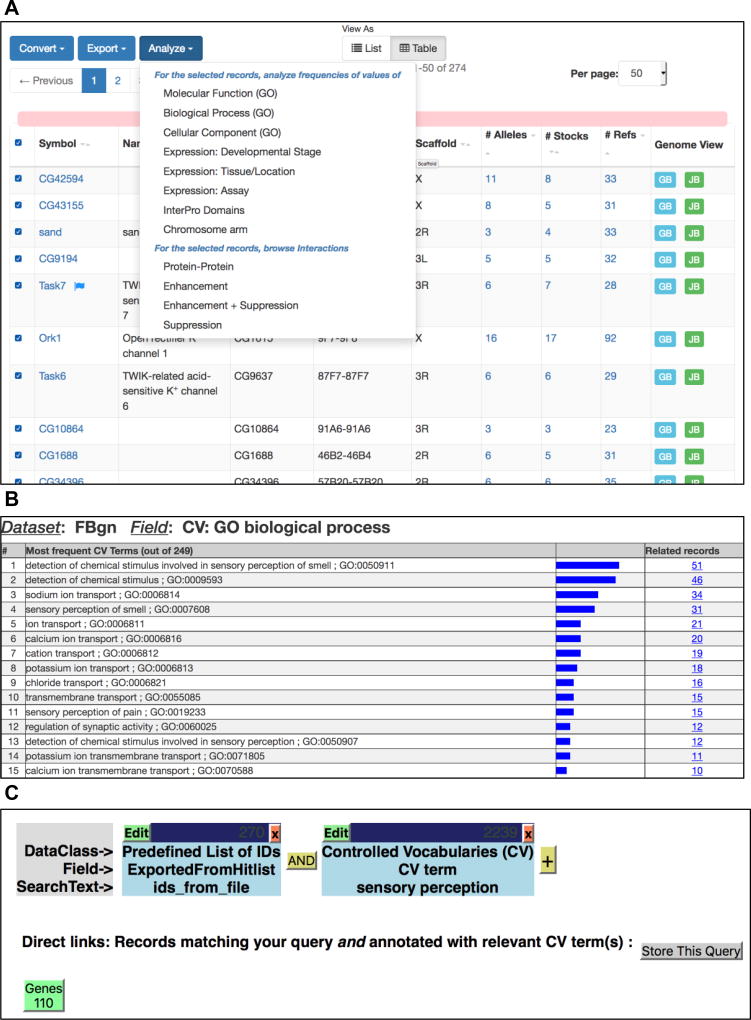
Fig. 5.
(a) A hit-list of genes. In this example, the hit-list is populated with genes exported from the ION CHANNELS Gene Group. The “Analyze” drop-down menu is shown. (b) A results analysis of individual Biological Process GO terms associated with genes from the ION CHANNELS Gene Group. (Only the top 15 most frequently associated GO terms are shown). (c) A QueryBuilder results page, showing a 2-leg query (top). First query: IDs imported from the ION CHANNELS Gene Group; second query: GO term search for “sensory perception.” A results button, with the number of genes returned from the query, is displayed at the bottom—clicking this generates a new gene hit-list.

