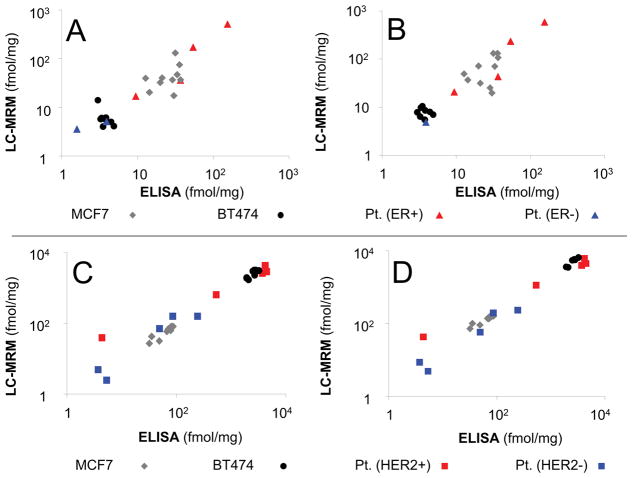
Figure 4. Comparison LC-SRM and ELISA for ER and HER2 Quantification in Cell Lines and Breast Tumor Tissues.
LC-SRM data for 2 peptides from ER, LLFAPNLLLDR (A) and YYITGEAEGFPATV (B), are compared against ELISA quantification for two control cell lines and 10 patient samples. The sample coding (upper right) applies to both panels. LC-SRM data for 2 peptides from HER2, ELVSEFSR (C) and ITDFGLAR (D), are compared against ELISA for the same 2 cell lines, but 10 different patient samples. The sample coding (lower right) applies to both panels. Additional data are shown in Supplementary Figures S7–9.

