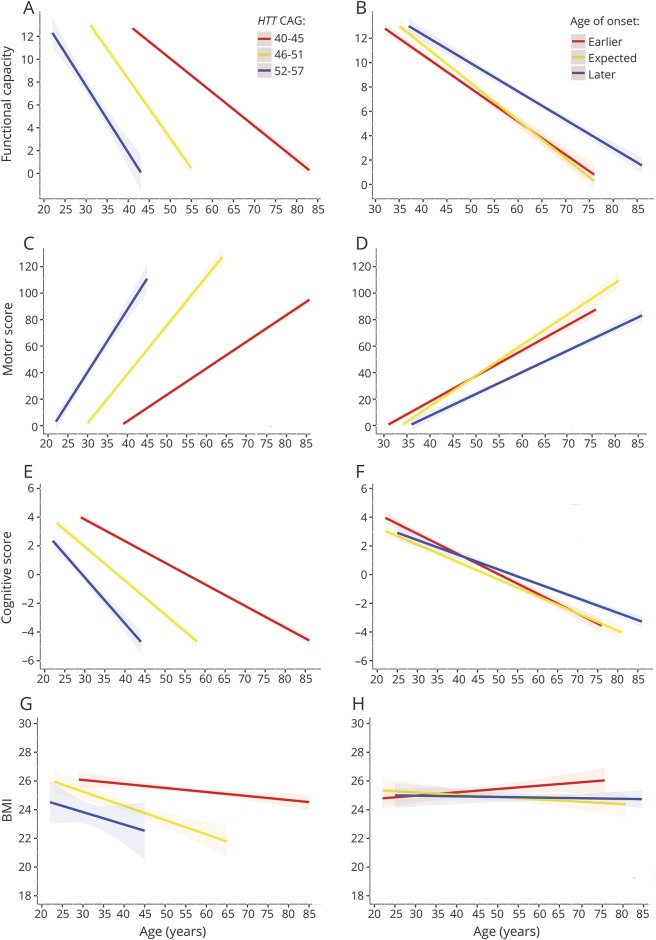
Figure 1. Association between the rate of clinical progression and HTT CAG repeat size and residual age at onset.
To further explore and visualize the data, we first divided the patient cohort in 3 different groups based on either CAG repeat size (A, C, E, and G) or residual age at onset (B, D, F, and H). Next, for each clinical measure and each category of CAG repeat size or residual age at onset, we applied a separate linear mixed-effects model to estimate the mean trajectory of change in clinical scores in time for different categories of HTT CAG repeat size or residual age at onset. The rate of deterioration on the Unified Huntington’s Disease Rating Scale total functional capacity (A) total motor score (C), a cognitive summary score (E), and body mass index (BMI) (G) increased significantly with a larger expanded HTT CAG repeat size. Conversely, the rate of functional (B), motor (D), and cognitive decline (F) was slower in those patients who had an age at onset later than that expected based on their expanded HTT CAG repeat size compared to those with an age at onset at or earlier than expected based on their expanded HTT CAG repeat size. However, residual age at onset had no influence on the rate of weight loss (H). The straight lines represent the mean predicted scores while the dashed areas around the regression lines denote the 95% confidence intervals of the mean. The 3 categories of expected age at onset, i.e., “earlier,” “expected,” and “later,” were defined based on tertiles of residual age at onset as minimum (−16.4) to ≤−2.3, >−2.3 to ≤2.9, and >2.9 to maximum (21.8) years, respectively.

