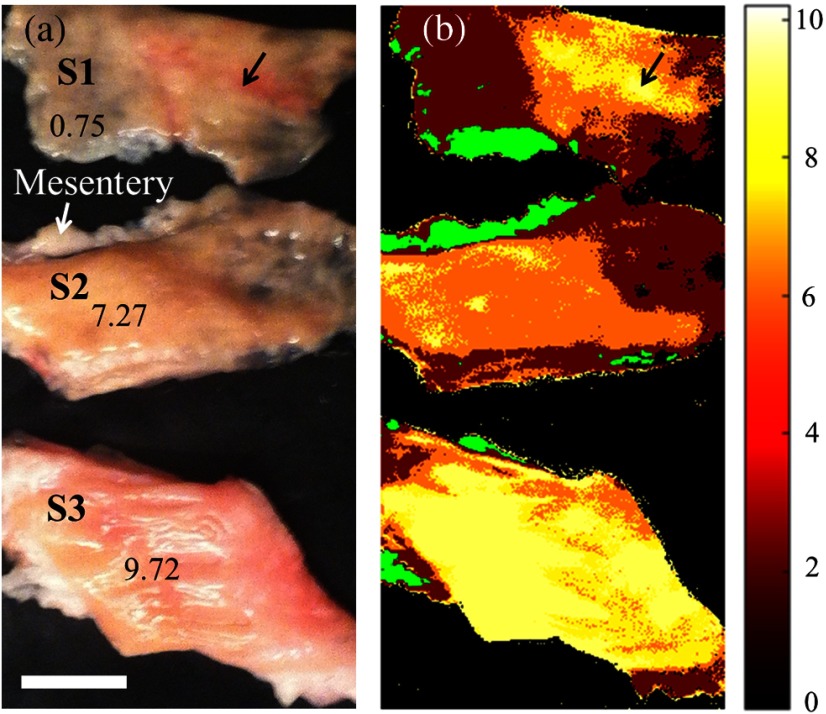
Fig. 5.
(a) Digital photograph of three bovine colon tissues with different specified thicknesses (units in mm). (b) Thickness differentiation using the SAM method, with a thickness-corresponding colormap. The mesentery is indicated as a different tissue in green color. Black arrows: thicker tissue areas; white scale bar: 10 mm; and colormap unit: mm.

