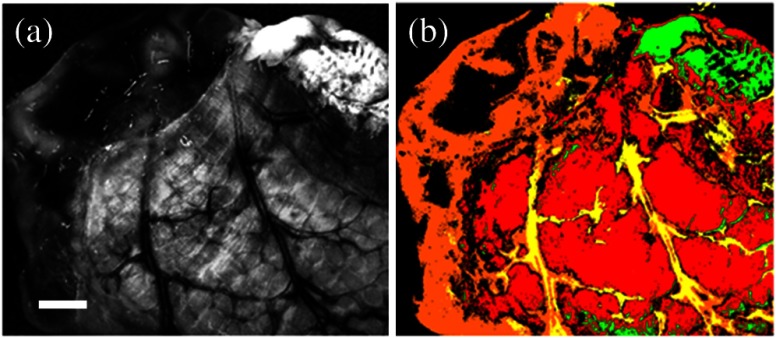
Fig. 6.
(a) Representative single-band reflectance image at 470 nm. (b) Thickness differentiation using the SAM method, with a thickness-corresponding colormap. The red color shows the thicker layer, and the orange color shows the thinner layer. Tissue classification of the mesentery (green) and blood vessels (yellow) was performed prior to the thickness analysis. White scale bar: 2 mm.

