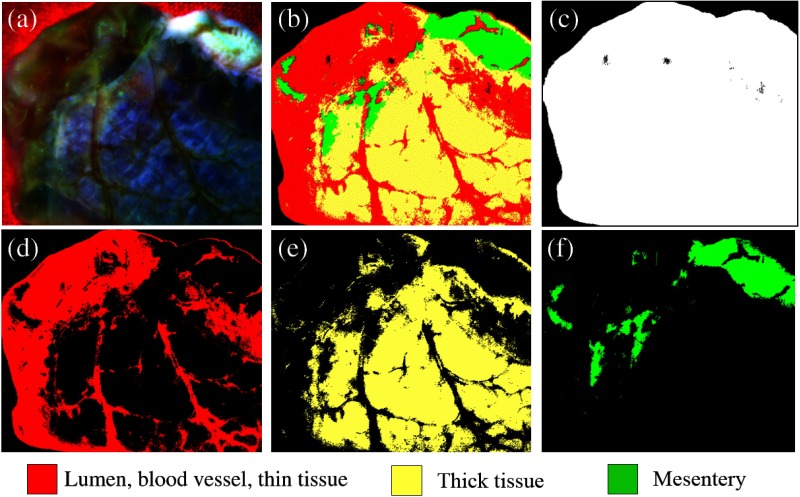
Fig. 8.
Multispectral tissue classification: (a) composite image created from three spectral band images; (b) classified image using the supervised classification algorithm; (c) background color-matching image (black); (d) image showing the vulnerable tissue (lumen, blood vessels, and thin tissue regions) (red); (e) image showing the thick tissue regions (yellow); and (f) image showing the mesentery (green).

