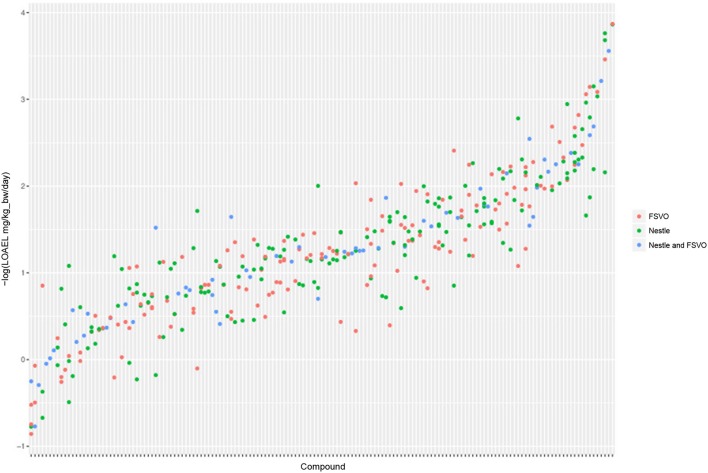
Figure 3.
LOAEL distribution and variability of compounds with multiple measurements in both databases. Compounds were sorted according to LOAEL values. Each vertical line represents a compound, and each dot an individual LOAEL value. Experimental variability can be inferred from dots (LOAELs) on the same line (compound).

