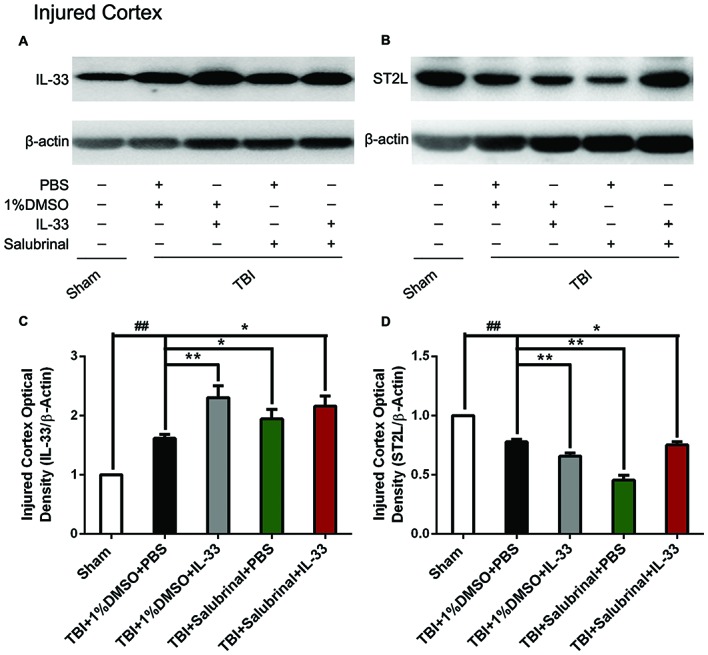
Figure 1.

The changes of IL-33 and ST2L expression after traumatic brain injury (TBI). (A,B) The changes of IL-33 and ST2L expression in cerebral cortex after TBI. (C,D) Optical densities of the protein bands were quantitatively analyzed. IL-33 (F(4,25) = 31.18; ##P < 0.01 vs. Sham group; **P < 0.01 vs. PBS group, *P < 0.05 vs. PBS group); ST2L (F(4,25) = 56.55; ##P < 0.01 vs. Sham group; **P < 0.01 vs. PBS group, *P < 0.05 vs. PBS group). The data were expressed as means ± SEM (n = 6/group). Experiments are representative of three independent experiments.
