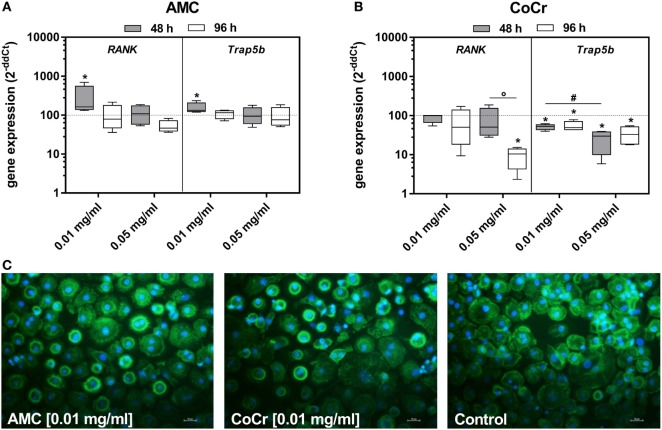
Figure 4.
Differentiation capacity of human PBMC cultures after exposure to AMC and CoCr particles in different concentrations. Cells were analyzed for gene expression levels of pro-osteoclastic differentiation marker by qRT-PCR (A,B). Data are shown as box plots (n = 4). Significances between groups were calculated with the Mann–Whitney U-test (*p < 0.05, treated vs. untreated; #p < 0.05, 0.01 vs. 0.05 mg/ml; °p < 0.05, 48 vs. 96 h). (C) Representative pictures of actin (green fluorescence) and cell nuclei (blue fluorescence) in PBMC cultures after 48 h of incubation with AMC and CoCr particles. Exposure to particles revealed an enhanced cell number with actin rings as well as formation of membranous ruffled border compared to untreated controls. Bar: 20 µm.

