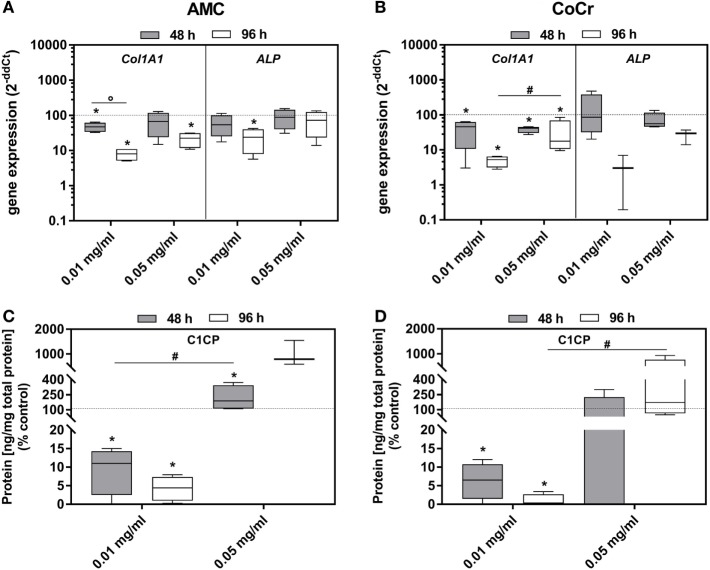
Figure 5.
Differentiation capacity of human osteoblasts after exposure to different concentrations of AMC and CoCr particles. Cells were treated with the respective particle to evaluate gene expression levels of osteogenic differentiation marker by qRT-PCR (A,B). (C,D) Cell culture supernatants were used to evaluate the concentration of pro-collagen type 1 (C1CP per total protein content). Data are shown as box plots (n ≥ 3). Significances between groups were calculated with the Mann–Whitney U-test (*p < 0.05, treated vs. untreated; #p < 0.05, 0.01 vs. 0.05 mg/ml; °p < 0.05, 48 vs. 96 h).

