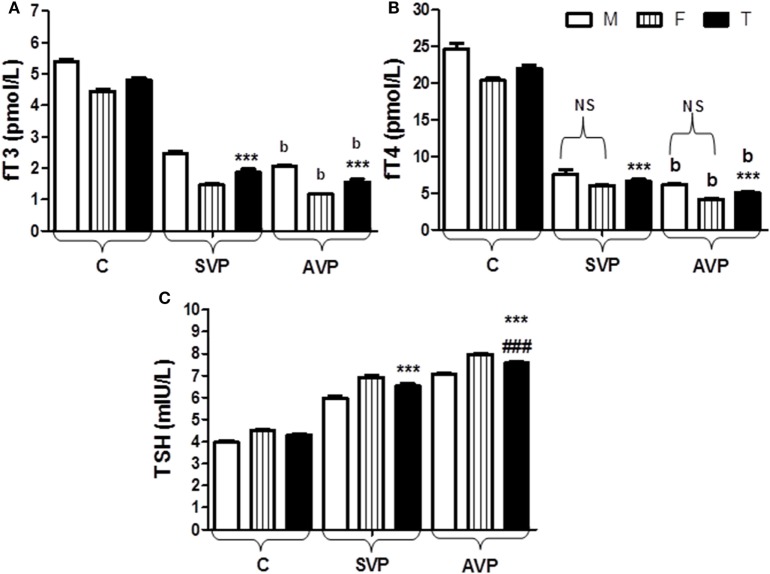
Figure 4.
Serum levels of fT3 (A), fT4 (B), and TSH (C) in vitiligo patients compared with control subjects. Values expressed as mean ± SEM. ***p < 0.001 significant vs. Control. ###p < 0.001 significant vs. SVP, b; non-significant vs. SVP (between groups Total vs. Total; Male vs. Male; Female vs. Female). NS is a non-significant within group (Male vs. Female). Abbreviations: C, control; SVP, stable vitiligo patient; AVP, active vitiligo patient; M, male; F, female; T, total; fT3, free triiodothyronine; fT4, free thyroxine; TSH, thyroid-stimulating hormone.

