Figure 1.
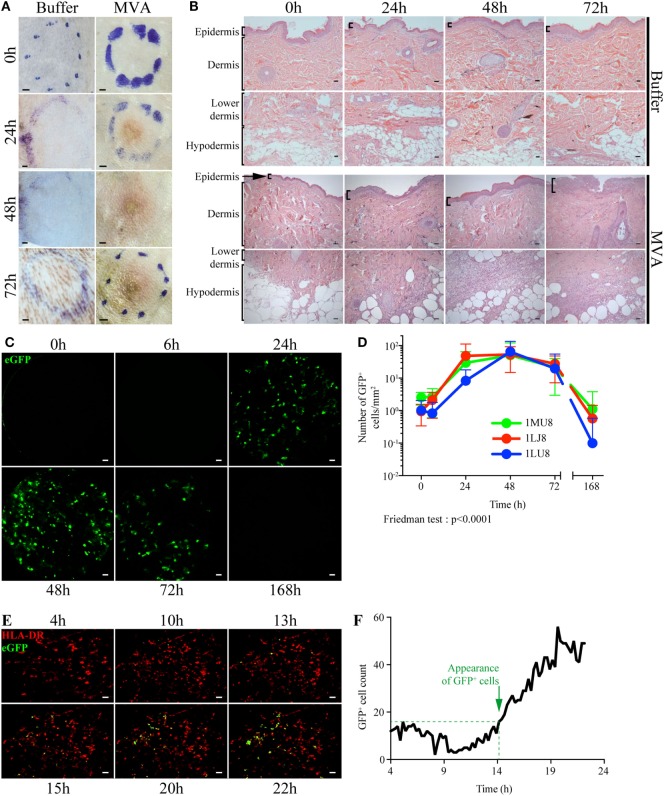
Dynamics of local inflammation and infection after intradermal injection of rMVA. (A) Image of the skin before and after Buffer or rMVA injection. Scale bars correspond to 2 mm. (B) HE staining of transversal sections of non-human primate skin biopsies taken at the site of injection before or 24, 48, or 72 h after Buffer or rMVA injection. Scale bars correspond to 100 µm. (C) Representative images recorded by in vivo confocal endo-microscopy. Recordings were performed at the site of injection in the dermis (at a depth of 100 ± 35 µm in the skin) with a probe detecting fluorescent signals after excitation at a wavelength of 488 nm. Green fluorescence corresponds to the production of GFP in rMVA-infected cells. Scale bars correspond to 50 µm. (D) Kinetic profile of GFP+ cells in the skin after rMVA injection. The graph represents the mean ± SD of the number of GFP+ cells/mm2 in the 50 frames with the most GFP+ cells. (E) Representative images from time-lapse video-confocal microscopy of HLADR+ (in red) and GFP+ (in green) cells after i.d. injection of rMVA. Skin biopsies were observed for 22 h p.i. Acquisition was performed at a depth of 50–150 µm in the skin (dermis) corresponding to a stack of 10 images. Visual representations correspond to a two-dimensional visualization of this stack at the indicated time p.i., after cropping the region of interest. Scale bars correspond to 20 µm. (F) Kinetic profile of GFP+ cell detection in the dermis during the first 22 h p.i. The graph indicates the number of GFP+ cells counted for each image (1 image each 15 min). Green objects between 200 and 4,000 µm3 were considered to be GFP+ cells. The approximate time of appearance of non-background GFP+ cells is indicated with the dotted line at 14–15 h p.i.

