Figure 4.
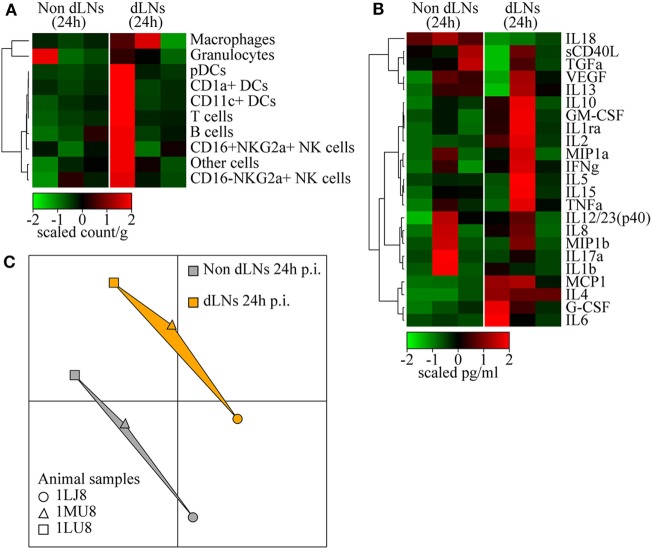
Immune reaction in the draining lymph nodes (LNs). (A) Heatmap representation of cell populations discriminated by flow cytometry in the inguinal LNs draining the sites of rMVA injection (dLNs) and the contralateral LNs (Non dLNs). Cell populations were automatically sorted following hierarchical clustering represented by the dendrogram on the left. The cell count/gram was calculated by dividing the number of events by the weight of the biopsies, which were collected 24 h p.i. Values were standardized to display the same range of expression values for each cell population to properly visualize the cell population kinetics. See Figure S3B in Supplementary Material for gating strategies. (B) Heatmap representation of cytokine release in the LNs after rMVA injection. Cytokine production was automatically sorted following hierarchical clustering represented by the dendrogram. Values were standardized to display the similar range of expression for each cytokine to properly visualize the cytokine production kinetics. (C) Multidimensional scaling representation of transcriptomic signatures in LNs 24 h after rMVA injection. Biological samples are represented as dots in a two-dimensional space. The distances between the dots are proportional to the Euclidian distances between the transcriptomic profiles.

