Figure 2.
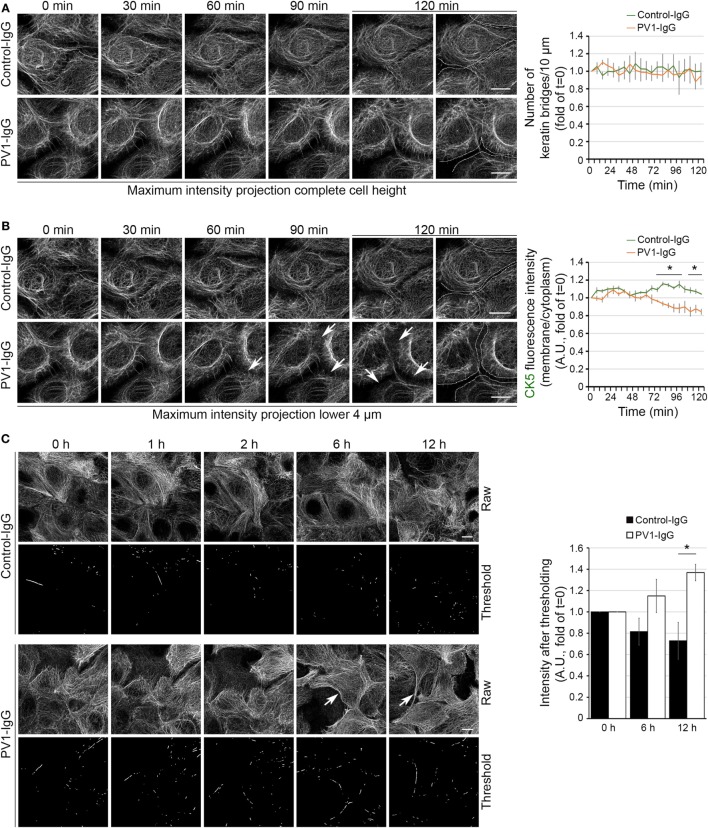
Time course of keratin changes after antibody binding. Representative image sequence of high resolution three-dimensional confocal time-lapse microscopy as a maximum intensity projection of the complete HaCaT-CK5 cell height (A). Images were acquired in 30-s intervals and number of keratin bridges was assessed every 6 min after PV1-IgG addition (n = 8–10 cells from three to four independent experiments, *p < 0.05 vs. Control-IgG at respective time point). (B) In a maximum intensity projection containing the lower 4 µm of the cell body, the ratio of fluorescence intensity in the cell periphery to fluorescence intensity in the cytoplasm was analyzed every 6 min. Arrows mark loss of fluorescence intensity in the cell periphery. Dashed lines indicate the cell border area and were drawn for better visualization (n = 8–10 cells from three to four independent experiments, *p < 0.05 vs. Control-IgG at respective time point). (C) Keratin bundling (arrows) was caused by PV1-IgG exposure. Bundling was visualized by putting a threshold on raw data and measuring the remaining intensity (n = 3–4, *p < 0.05 vs. Control-IgG at respective time point). Bars represent 10 µm.

