Figure 3.
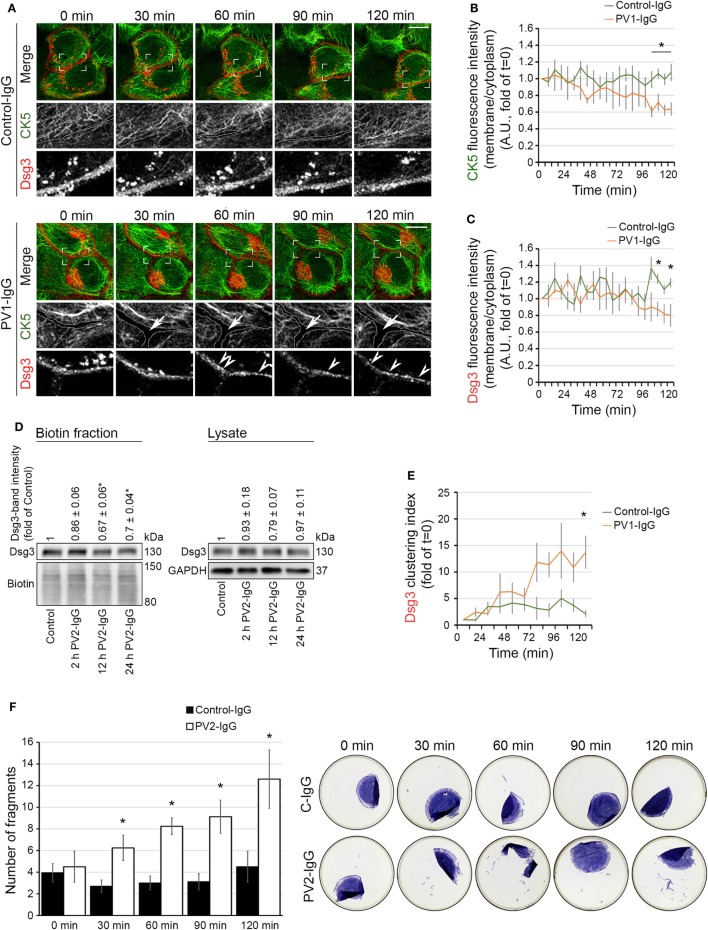
Keratin changes and Dsg3 clustering occurred in parallel and preceded Dsg3 internalization. HaCaT keratinocytes expressing CK5-YFP were transfected with Dsg3-mCherry. In three-dimensional confocal time-lapse microscopy experiments, cells were incubated with either PV1-IgG or Control-IgG and imaged every 2 min for 120 min. Dashed lines indicate cell border areas (A). Ratio of CK5 fluorescence intensity and in the cell periphery vs. intensity in the cytoplasm was assessed (B) (n = 5–6 cells, each from an independent experiment, *p < 0.05 vs. Control-IgG at respective time point). Ratio of Dsg3 distribution in the membrane vs. the cytoplasm (C) (n = 5–6, *p < 0.05 vs. Control-IgG). Streptavidin pulldown of biotinylated membrane Dsg3 after 2, 12, and 24 h of PV2-IgG incubation and densitometric analysis of protein levels (n = 3–4, *p < 0.05 vs. control) (D). Dsg3 clustering was evaluated with intensity profile plotting linearly along the membrane (n = 5–6, *p < 0.05 vs. Control-IgG at respective time point) (E). Loss of cell adhesion caused by incubation with PV2-IgG was measured in parallel to structural changes at early time points by dispase-based dissociation assay (F) (n = 4–5, *p < 0.05 vs. respective Control-IgG incubation).

