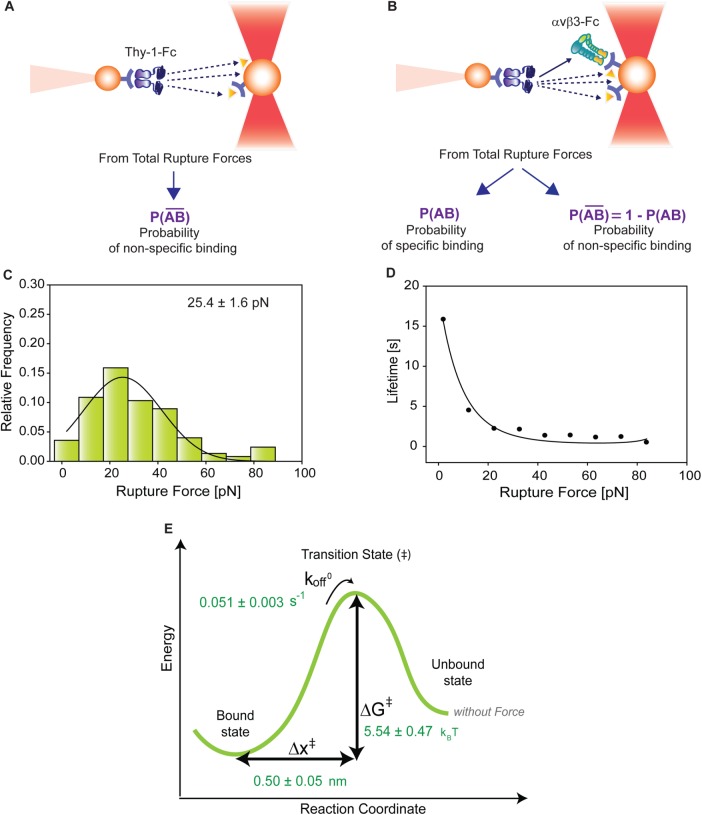
FIGURE 3:
Correction for nonspecific rupture events and quantification of the binding parameters between pure Thy-1-Fc and αvβ3-Fc integrin in supernatant. To obtain rupture forces representative of only specific binding events between Thy-1-Fc and the αvβ3-Fc integrin, we developed a mathematical strategy (see Materials and Methods) to correct rupture forces resulting from nonspecific binding events. Assumptions made: (A) from the total rupture forces observed between Thy-1-Fc and beads preincubated with supernatant from cells transfected with mock plasmid, where  indicated the probability of a nonspecific binding (dashed line arrows) and (B) from the total rupture forces observed between Thy-1-Fc and supernatant containing αvβ3-Fc, where
  indicated the probability of a nonspecific binding and P (AB) indicated the probability for specific binding interactions (solid line arrow). (C) Resulting rupture force histogram after applying mathematical corrections, representative of only specific Thy-1-Fc/αvβ3-Fc interactions. Black line in the histogram corresponds to a Gaussian distribution curve used to illustrate the distribution and peak of rupture forces. (D) Force-dependent lifetime for Thy-1-Fc/αvβ3-Fc binding estimated from each bin shown in C, using the the Dudko-Hummer-Szabo model (Eq. 1; see Materials and Methods). Solid line in D corresponds to the fitted curve obtained using Eq. 2 (see Materials and Methods; υ = 0.5). (E) Energy landscape of the unbinding process between Thy-1-Fc and the αvβ3-Fc integrin in the supernatant, where off-rate at zero force (koff0), distance to the transition state (Δx‡), and the free energy of activation (ΔG‡) are shown.

