FIGURE 5:
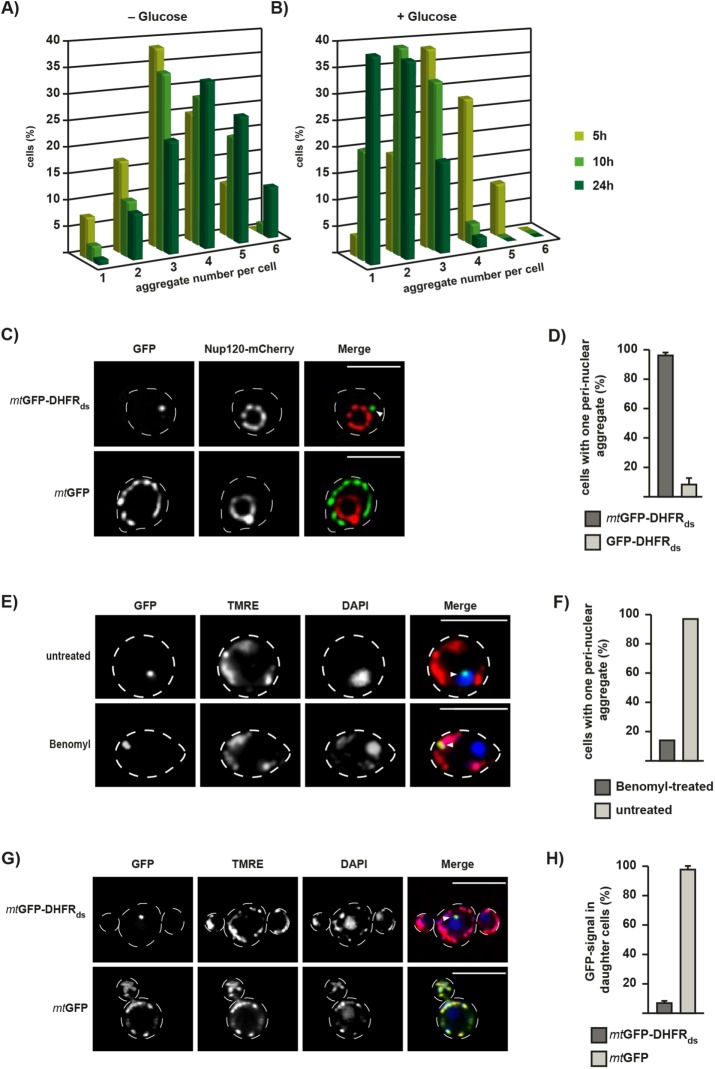
Formation of IMiQ leads to aggregate sequestration at the nucleus. (A, B) Quantification of aggregate numbers in cells expressing mtGFP-DHFRds. Expression was either continuous up to 24 h (A) or stopped after 2.5 h by the addition of 2% glucose (B). Live cells were analyzed by fluorescence microscopy and GFP-positive dots were counted in 200 cells each after 5 h (light green), 10 h (green), and 24 h (dark green). IMiQ structures in all focal planes throughout a cell were counted. The entirety of all expressing cells was set to 100%. (C) Perinuclear localization of IMiQ. Yeast cells expressing the nuclear pore protein Nup120-mCherry (red), mtGFP-DHFRds, or the control protein mtGFP (green) for 5 h were analyzed by fluorescence microscopy. Arrow indicates IMiQ structure. Scale bar: 5 µm. (D) Quantification of aggregate localization. Cells expressing mtGFP-DHFRds (dark-gray) or cytosolic GFP-DHFRds (light-gray) for 5 h that contained mitochondrial aggregates located in the nuclear periphery were counted (100 cells each, set to 100%). Mean values and SEM bars are shown (n = 3). (E) Perinuclear localization of IMiQ is dependent on microtubule function. Cells expressing mtGFP-DHFRds were treated with 100 µg/ml benomyl (Sigma Aldrich, Germany) for 5 h and analyzed by fluorescence microscopy. Mitochondria were visualized by TMRE staining (red) and nuclei by DAPI staining (blue). Scale bar: 10 µm. (F) Quantification of benomyl-treated cells. Cells were analyzed as described in D. (G) Distribution of IMiQ structures during cell division. Fluorescence microscopy of live yeast cells expressing the indicated proteins for 5 h. Expression was stopped by the addition of 2% glucose and cells were incubated at 30°C for an additional 3 h. Mitochondria were visualized by TMRE staining (red) and nuclei by DAPI staining (blue). Scale bar: 10 µm. (H) Quantification of yeast cell buds containing aggregate structures. Cells expressing indicated reporter proteins were analyzed by fluorescence microscopy as above. 100 daughter cells during the budding process (as assessed by phase-contrast imaging) were analyzed for the presence of GFP-positive dots in three independent experiments. Shown are mean values and SEM (n = 3).

