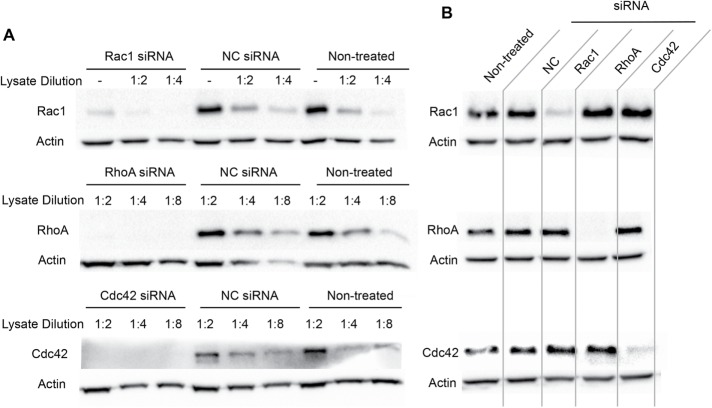
FIGURE 1:
Rac1, RhoA, and Cdc42 knockdown efficiencies. (A, B) Western blot analysis of Rac1, RhoA, and Cdc42 in nontreated HepG2 cells and in HepG2 cells treated with a negative control siRNA (NC) or with Rac1-, RhoA-, or Cdc42-specific siRNAs. (A) Western blot analysis of cell lysates (nondiluted, 1:2, 1:4, and 1:8 diluted) using anti-Rac1, -RhoA, -Cdc42, and -actin antibodies. (B) Western blot analysis of nondiluted cell lysates to verify the absence of compensatory expression of Rac1 (top), RhoA (middle), or Cdc42 (bottom) in cells treated with Rac1-, RhoA-, and Cdc42-siRNAs. All Western blots are representative of at least three independent experiments.

