FIGURE 3:
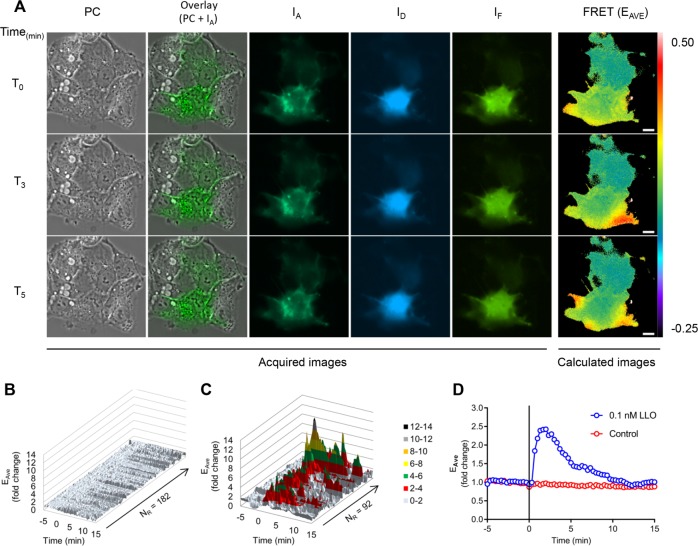
FRET stoichiometry to monitor Rac1 activation by LLO. HepG2 cells coexpressing mCFP-PBD and mCit-Rac1 were imaged on the microscope stage at 37°C. Phase-contrast (PC), and fluorescence images (IA, ID, and IF) were acquired every 20 s for 20 min. LLO was added after 5 min of imaging (T0). (A) PC, overlay of PC and IA, IA, ID, IF, and FRET (EAVE presented in pseudocolor scale). Scale bar = 10 μm. From top to bottom: time points 0, 3, and 5 min after addition of LLO. (B, C) For each imaged cell, two regions of standard size (305 pixels) were applied at locations where FRET variations were observed. If no FRET variation was observed, then the regions were arbitrarily positioned. The y-axis indicates the fold change in EAVE and the z-axis represents all individual regions of control cells (182 regions, 91 cells) (B), and all FRET-positive regions from the LLO-exposed cells (92 regions, 57 cells) (C), in which FRET positive is defined as a greater than twofold increase in FRET efficiency (n = 3). (D) Kinetics of the averaged EAVE of control (182) and LLO-exposed (92) regions. The black vertical line indicates the time of addition of medium alone (control) or 0.1 nM LLO.

