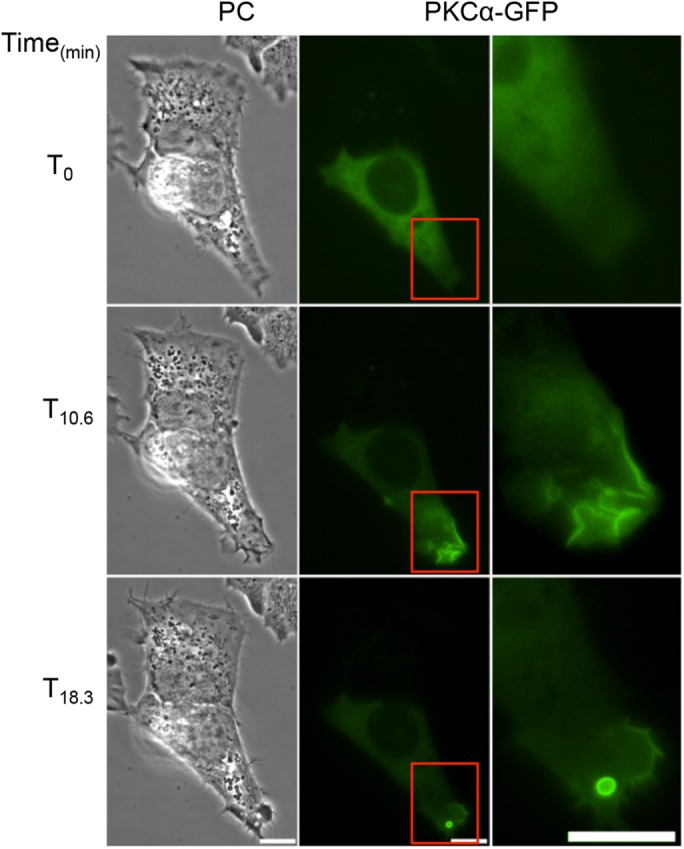
FIGURE 7:

LLO induces PKCα translocation to the plasma membrane. HepG2 cells expressing GFP-PKCα were imaged on the microscope stage at 37°C. Phase-contrast (PC), and fluorescence images were acquired every 20 s for 20 min. LLO was added after 5 min of imaging (T0). LLO induces GFP-PKCα translocation to regions of dynamic plasma membrane ruffles and around newly formed vesicles. Regions highlighted in column 2 are shown in column 3. Scale bar = 10 μm.
