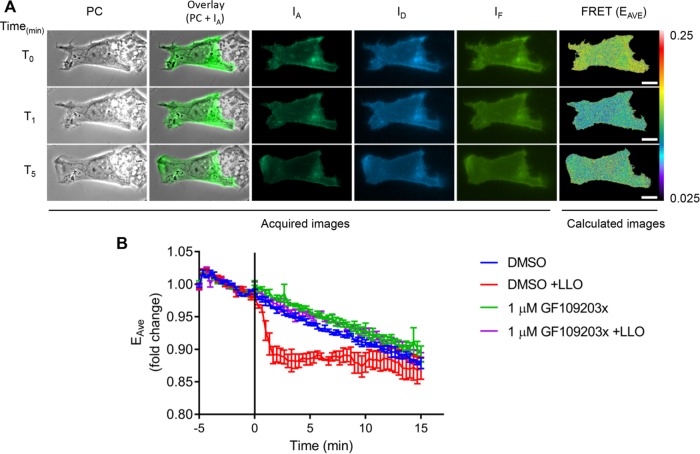
FIGURE 8:
A PKC is activated by LLO. HepG2 cells expressing MyrPalm-CKAR were imaged on the microscope stage at 37°C. Phase-contrast (PC) and fluorescence images (IA, ID, and IF) were acquired every 20 s for 20 min. LLO was added after 5 min of imaging (T0 and black vertical line). (A) A representative cell exhibiting LLO-induced MyrPalm-CKAR phosphorylation. From left to right: PC, overlay of PC + IA, IA, ID, and IF, and FRET (in pseudo-color scale). From top to bottom: time points 0, 1, and 5 min after addition of LLO. Scale bar = 10 μm. (B) Data are presented as the average fold change in EAVE ± SEM (n = 3, 24 cells in DMSO control, 26 cells in GF109203x, 28 cells in DMSO +LLO, and 26 cells in GF109203x +LLO).

