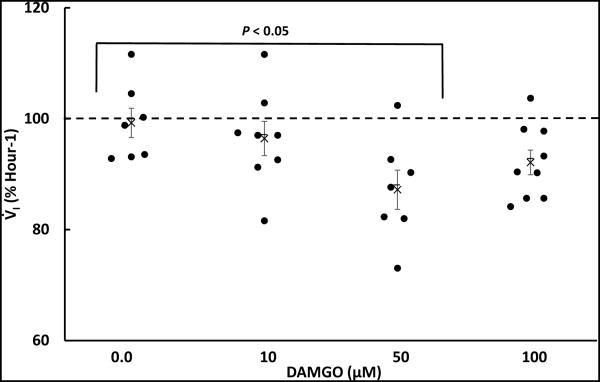
Figure 3.
Because of the trend of a transient reduction in V̇I over the last 30 minutes of DAMGO dialysis (Figure 2), a moving time average was computed using 3 successive 5 minute intervals and the lowest value for each goat over the last 30 minutes of DAMGO dialysis and mCSF are plotted in this figure (filled circles). Average values for each dose of DAMGO are plotted using mean symbols, data are means ± SE. One-way ANOVA indicated V̇I as a percent of control differed significantly (P < 0.042) over the 4 conditions shown. The post hoc test indicated the responses to 0 and 50 μM differed significantly (P < 0.05).

