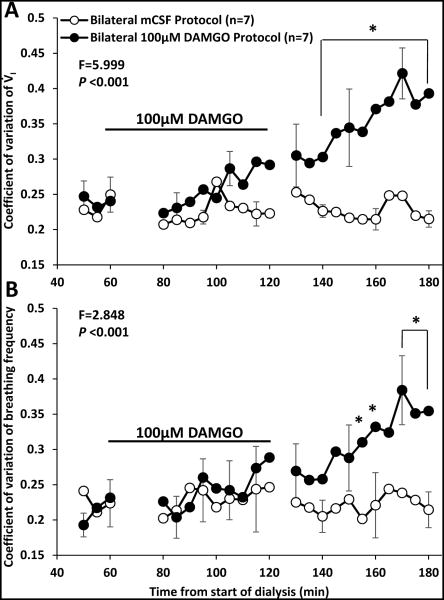
Figure 8.
The coefficient of variation of ventilation (V̇I, panel A) and breathing frequency (f, panel B) within 5 minute periods was significantly (P < 0.001) greater during the period after bilateral 100 μM DAMGO dialysis than after bilateral mCSF dialysis. Data are means ± SE. The x Axis is time from start of 180 minutes of dialysis. As indicated by the black line, DAMGO was dialyzed between 60 and 120 minutes. The F and P values are interaction terms from two-way repeated measures ANOVA using dose and time as factors. Asterisks denote values different between open and closed symbols (P < 0.05, post hoc test).

