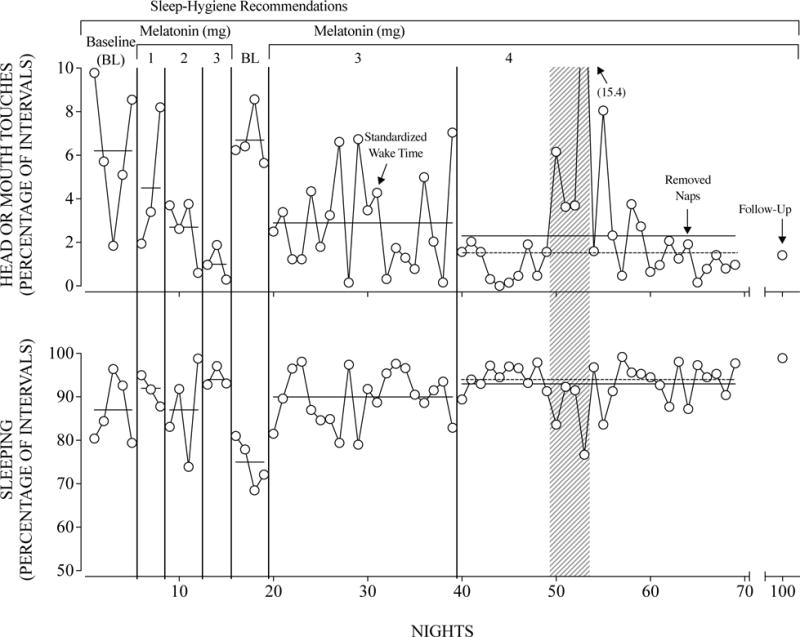
Figure 1.

Percentage of intervals with head or mouth touches (top panel) and percentage of intervals of the night asleep (bottom panel) across nights. Nights on which Kari was sick are shaded gray. Solid horizontal lines indicate phase means. Dotted horizontal lines indicate the phase means without the nights on which Kari was sick.
