Abstract.
Neural electrodes and associated electronics are powered either through percutaneous wires or transcutaneous powering schemes with energy harvesting devices implanted underneath the skin. For electrodes implanted in the spinal cord and the brain stem that experience large displacements, wireless powering may be an option to eliminate device failure by the breakage of wires and the tethering of forces on the electrodes. We tested the feasibility of using optically clear polydimethylsiloxane (PDMS) as a waveguide to collect the light in a subcutaneous location and deliver to deeper regions inside the body, thereby replacing brittle metal wires tethered to the electrodes with PDMS-based optical waveguides that can transmit energy without being attached to the targeted electrode. We determined the attenuation of light along the PDMS waveguides as and the transcutaneous light collection efficiency of cylindrical waveguides as by transmitting a laser beam through the thenar skin of human hands. We then implanted the waveguides in rats for a month to demonstrate the feasibility of optical transmission. The collection efficiency and longitudinal attenuation values reported here can help others design their own waveguides and make estimations of the waveguide cross-sectional area required to deliver sufficient power to a certain depth in tissue.
Keywords: transcutaneous wireless neural stimulation, floating multielectrode arrays, spinal cord neuroprosthesis
1. Introduction
Neural electrodes have employed state-of-the-art technologies to produce the finest two- and three-dimensional constructs for selective neural stimulation and neural activity recording in the central and peripheral nervous systems.1–5 Thus far, the electrode arrays implanted in the brain are mostly tethered to the electronics via fine metal wires.6 The brain continuously moving inside the skull as a viscoelastic structure causes two fundamental problems that are at a trade-off with each other.7 First, the shear forces generated at the tissue/electrode interface increase with the thickness of the wires due to the increasing tethering forces acting upon the electrodes, and these shear forces in turn cause a chronic scar tissue formation around the electrode.8 Second, the lifetime of the wires is severely limited by the continuous movement of the electrodes, and wire breakage becomes a serious issue as they are made thinner to minimize the tethering forces.9 Ideally, conductive materials with maximum flexibility and also with maximum durability under bending forces are desired for the electrode interconnects.
With wireless powering and signal telemetry, the electrode shanks can float inside the neural tissue and the glial scar formation can be minimized6 while the wire breakage problem is eliminated altogether. To this end, a few different forms of energy transmission can be brought to attention as potential schemes for powering the implants: the optical, electromagnetic, and acoustic methods. An optical form of energy has a particular advantage that it can be guided and transmitted through an optical fiber much easier than the latter two.10 If the waveguide is attached to the electrode array, a glass or plastic11 optical fiber is not a better choice than a metal wire with regards to its flexibility and durability inside a viscoelastic medium. However, highly flexible and optically transparent polymers such as the polydimethylsiloxane (PDMS) can be considered for optical power delivery.12–14 The PDMS is also highly durable under repeated bending forces, biologically inert,15 and has been shown to survive in biological tissue for years in neural electrode implants.16 Currently, the usage of PDMS waveguides for optical powering of implantable neural electrodes is nonexistent in the literature. If the optical waveguide terminates near the electrode array without directly attaching it and delivers the light by penetration though the surrounding tissue, the tethers can be eliminated completely and the electrode array becomes truly floating. We are favoring this approach for powering and telemetering the control parameters to floating electrodes in highly mobile parts of the central nervous system (CNS), such as the spinal cord and, potentially, the midbrain and the brainstem.17–19
The spinal cord is probably the CNS region that experiences the largest displacements of all.20–22 Currently, there are no attempts to place any microstimulators or electrodes into the human spinal cord because of the potential risk of neural injuries resulting from the tethers as well as the electrode itself. Wire breakage issues and the short lifetime of neural electrodes discourage researchers from testing neural prosthetic ideas even in experimental animals. Only a few research groups attempt chronic animal testing of spinal electrodes.23,24 Floating electrode arrays are the most likely solution to the tethering problem that may pave the way to more wide spread animal experimentation and perhaps clinical testing in the future. Indeed, untethered floating microelectrodes and probes have shown minimal scar tissue formation around the devices () in the rat spinal cord.25 The optical waveguide approach may provide an efficient wireless energy transfer option and the depth of penetration needed for this application is discussed at the end of the paper. In this study, we are testing the feasibility of using PDMS waveguides for the transcutaneous transfer and transmission of optical energy several centimeters into the tissue as a method of powering floating microstimulators implanted on the spinal cord. The spinal cord presents unique challenges that are different than the brain cortex due to its extreme mobility and the depth to which the wireless energy needs to be delivered.
The maximum optical power that the human skin can be exposed to is defined by American National Standard Z136.1. The maximum permissible exposure (MPE) at the wavelengths within the optical penetration window of live tissue is based on the formulations given in this standard.26 The instantaneous power in a train of light pulses can theoretically be higher so long as the average power (hence the local temperature) stays below the MPE. In order to take advantage of this averaging effect, however, one needs to ensure that the pulse durations are much shorter compared to the thermal time constant of the tissue, so that the peak temperatures at the end of individual pulses do not exceed the temperature level that would be imposed by a nonpulsatile illumination at the MPE limit. Fortunately, this condition can be satisfied easily since the thermal time constant of the neural tissue is in the order of a few hundred milliseconds.27
The light power collected transcutaneously with a waveguide will be proportional to its cross-sectional area. Because the MPE limits the amount of light exposure per unit area of the skin, the waveguide cross-section has to be increased to transmit more power. Then, a trade-off comes into play between the thickness of the optical waveguide and the maximum power that can be delivered, where thicker waveguides will be less flexible. A significant relief to this equation comes from the fact that the Young’s modulus for PDMS is around 2 to 5 MPa depending on the PDMS type, and it is five orders of magnitude smaller than that of metal wires. For instance, Pt-10%Ir has a young modulus of around 202 GPa,28 MP-35N is 234 GPa (Fort Wayne Metals),29 and typical glass fibers are .30 Furthermore, the same waveguide for power delivery can also be utilized for optical data transfer between the implant and the external electronics within a much wider bandwidth than most other methods of signal telemetry.
In this study, we first report our work on fabrication and testing of PDMS-based optical waveguide transmission efficiencies ex vivo. Then, light collection efficiencies of the waveguides are measured through human hand skin noninvasively. Lastly, we demonstrate the feasibility of transcutaneous light collection and transmission in chronically implanted rats. The advantages of the proposed method are illustrated with numerical examples by comparing it to electromagnetic and acoustic methods of wireless power delivery in the context of spinal cord microstimulation.
2. Methods
2.1. Optical Waveguide Design and Fabrication
The PDMS-based waveguides were designed in two different cross-sectional areas; circular and rectangular. The main motivation for choosing these shapes was to obtain waveguides with uniform or directional flexibility. The rectangular profile requires lower forces to flex about the longitudinal axis of the cross-sectional area and thereby reducing the shear forces on the facets with larger surface areas. The circular design has a uniform structure and similar flexibility in all directions.
It has been reported that curing the duration and temperature affect PDMS properties,31–34 and no characterization was performed in order to investigate the effect of those parameters in this study. We followed the recommended curing parameters given by the manufacturer to achieve optimal refractive indices for OE-6550 and Slygard 184.35,36
The fabrication process mainly involves casting a two-layered core-cladding PDMS structure with different refractive indices; one with a relatively higher index for the core (, , Dow Corning OE-6550) and another with a lower index (, , Dow Corning Slygard 184) for cladding to maximize confinement of the light beam. This core-cladding structure resulted in a waveguide numerical aperture (NA) of , which defines the tip angle of the light-receiving cone. The higher the NA value, the more light is captured for transmission through the waveguide. With a larger NA, smaller bending radii are also possible without leaking light from the side walls, which is important when designing deformable waveguides.
2.1.1. Cylindrical design
The fabrication of a PDMS core began by mixing two parts of OE-6550; a curing agent (OE-6550A) with PDMS liquid prepolymer (OE-6550B) for about 15 min. After achieving a homogeneous mixture, the solution was placed in a vacuum for 30 min to remove air bubbles that were trapped within the mixture. The OE-6550 mixture was then withdrawn into a 10-cc syringe and placed in a vacuum chamber for 10 to 15 min in case air bubbles reformed during the withdrawn procedure. The mixture was injected into a Teflon tubing (0.8 mm ID, McMaster) using a 19-gauge needle. Once the tubing was filled with OE-6550, it was baked at 60°C for 8 h. Then, the tubing was stripped from the cured core by making a cut at one end and pulling apart. The Teflon tubing did not stick to PDMS and produced very smooth surfaces necessary for light confinement.
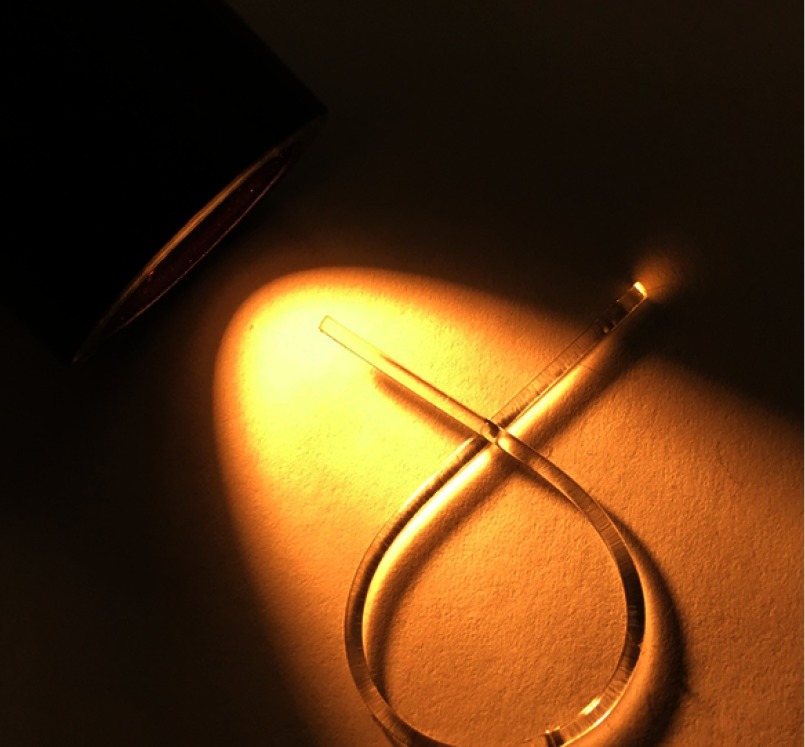
The cladding mixture was prepared following similar steps using Slygard 184 A/B liquid prepolymers. The core prepared earlier was held by fine tip forceps and dipped into the cladding mixture, gently pulled up by hand and then hung inside the oven to be cured vertically at 80°C for 2 h. The cladding prepared this way had a thickness of . The waveguides resulting from this fabrication process had a total diameter of (Fig. 1).
Fig. 1.
A sample cylindrical profile PDMS waveguide.
2.1.2. Laminar design
After mixing and degassing the PDMS solution (OE-6550, Dow Corning), a -thick layer was poured on a glass plate. The mixture was left to rest on the glass plate for 30 min then baked at 60°C for 8 h. The core was peeled from the glass plate and sliced with a razor blade at width. The cladding was made following the dipping method described for the cylindrical waveguides. The edges were not perfectly uniform after pulling them out from the cladding mixture. Thus, the laminar designs had relatively higher thickness variations. The final laminar waveguide designs had a cross-sectional area of after curing.
2.2. Ex Vivo Light Attenuation Measurements
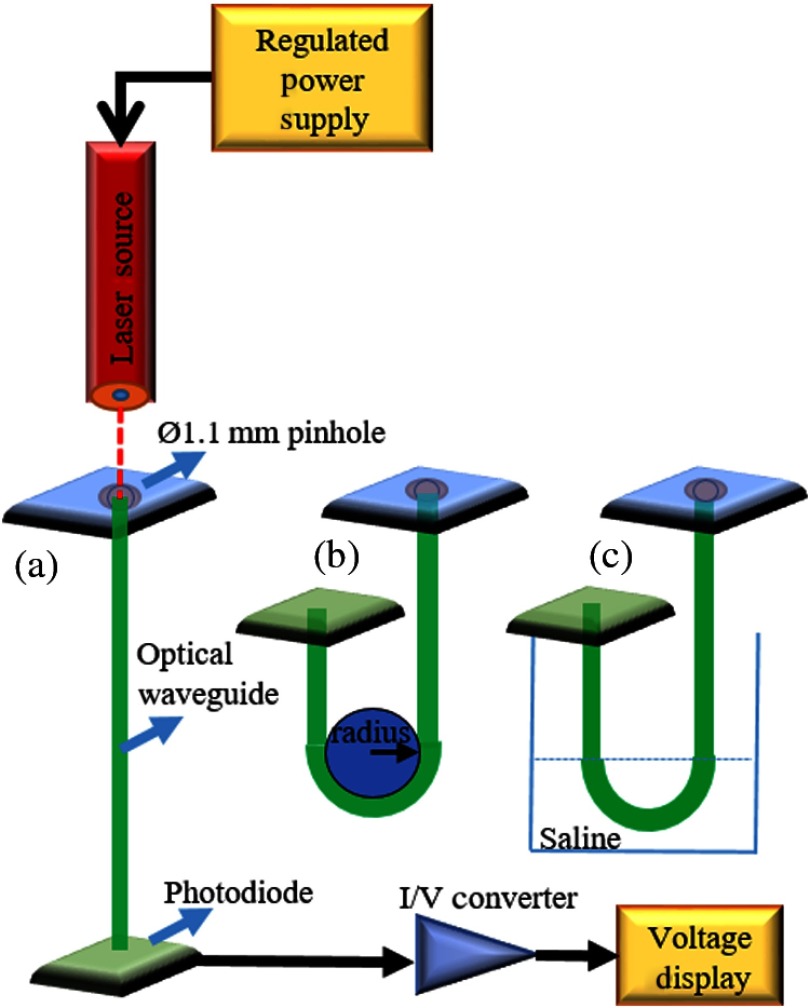
In order to determine the attenuation of light per unit length of the fabricated cylindrical and laminar waveguides, the cutback method was employed. A 15-cm waveguide was coupled to a red laser diode (635 nm, 4.9 mW, Thorlabs) and the light exiting from the other end was collected with a silicon photodiode ( active area, Thorlabs) for measurements of attenuation in straight positioning (Fig. 2). Light intensity measurements were taken for waveguide lengths of 15 cm down to 5 cm by progressively cutting 5 mm of the waveguide each time. The collected light power was calculated by dividing the electrical current output of the photodiode by the photodiode responsivity () provided by the manufacturer. The total attenuation () in dB units was found using
| (1) |
where is the light power entering the waveguide and is the output power measured by the photodiode.
Fig. 2.
Experimental setup for light attenuation measurements at (a) straight positioning, (b) 180 deg bending in air, and (c) 180 deg bending in saline.
Attenuation measurements were repeated by bending the waveguides at 180 deg in air and in saline in order to mimic the in vivo conditions of an implant. The refractive index of saline is about 1.33, which is close to the refractive index of interstitial tissue (1.35).37
2.3. Light Transmission Through Human Skin
2.3.1. Participants
Healthy subjects with the age of were recruited following the guidelines approved by New Jersey Institute of Technology Institutional Review Board. Subjects with a history of malignancy, as well as people who had a scar or a wound on the hand skin were excluded. Body mass index (BMI) was calculated using the formula.
Thirteen volunteers with an average age of () met the inclusion criteria and enrolled in this study. In this group, the frequency of gender was and ; the BMI was distributed as , , and . The skin colors of subjects were grouped into categories following the Fitzpatrick scale:38 (I) types 1 and 2 (pale white and white), (II) types 3 and 4 (cream white and moderate brown), and (III) types 5 and 6 (dark brown and darkest brown) based on visual inspection. The distribution of skin color in this group was types 1 and , types 3 and , and types 5 and .
2.3.2. Experimental setup
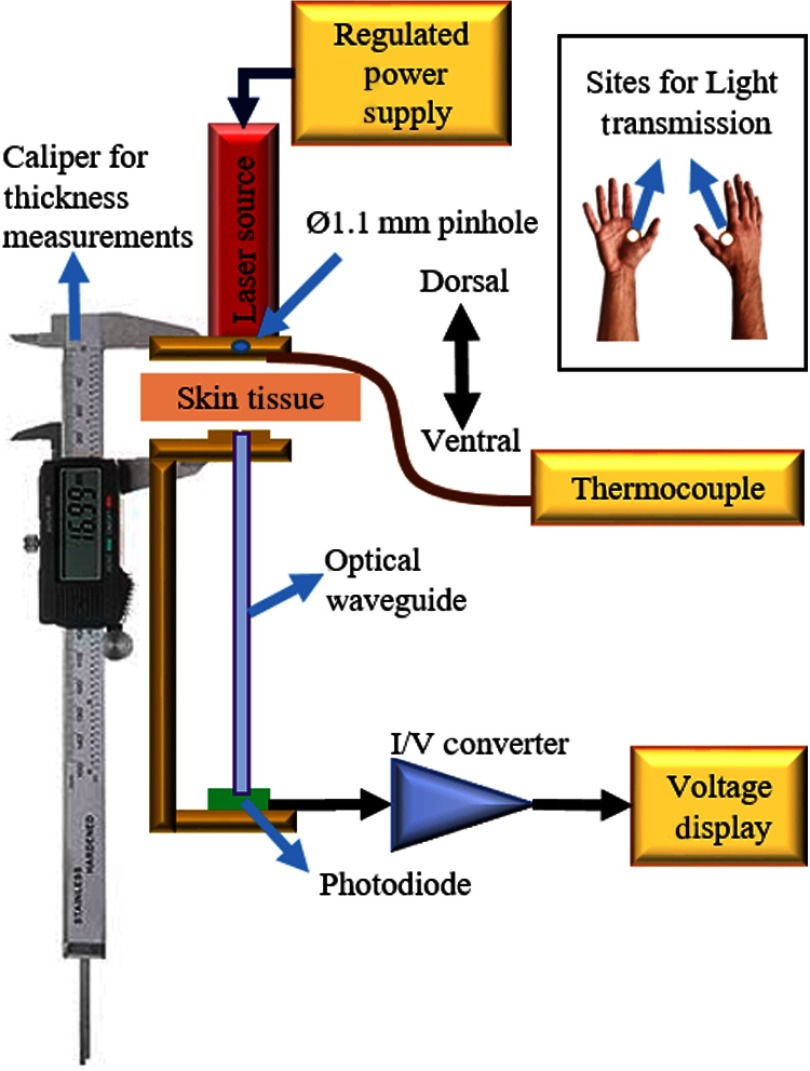
The skin flap (thenar web space) between the thumb and the index finger in both hands was cleaned using 70% ethanol to remove residues that could affect light measurements. The setup consisted of a semiconductor laser module (650 nm, 4.9 mW, Flexpoint, Uberlingen, Germany) as a light source and a photodiode (FDS1010-CAL, active area, Thorlabs) as a detector. The diameter of the collimated light beam was set to by passing it through a pinhole and aligning it with the waveguide tip on the other side of the hand (Fig. 3). Laser sources with two different wavelengths (635 and 650 nm) were used based on their commercial availablity in different powers and packages. We do not expect the given wavelength differences to influence the results since the light transmission profile of the selected PDMS is quite flat within the range of visible light spectrum.
Fig. 3.
Setup for light collection through the hand skin. Inset: representative images of the right hand showing the point of measurement spotted in white.12
A commercial caliper [6′′ Victor Machinery Exchange (VME) Electronic Caliper, VME] was utilized to hold the light source and 5-cm long waveguide in alignment. The subject’s hand was placed between the caliper jaws facing down and tightened gently to make a good skin contact while being careful not to compromise the blood circulation. The thickness of the skin was recorded as well as the light power () exiting on the ventral site of the thenar skin flap. The local skin temperature was measured by a T-type thermocouple, sandwiched between the laser source and the skin, after allowing the temperature to stabilize for 5 s.12
2.3.3. Data analysis
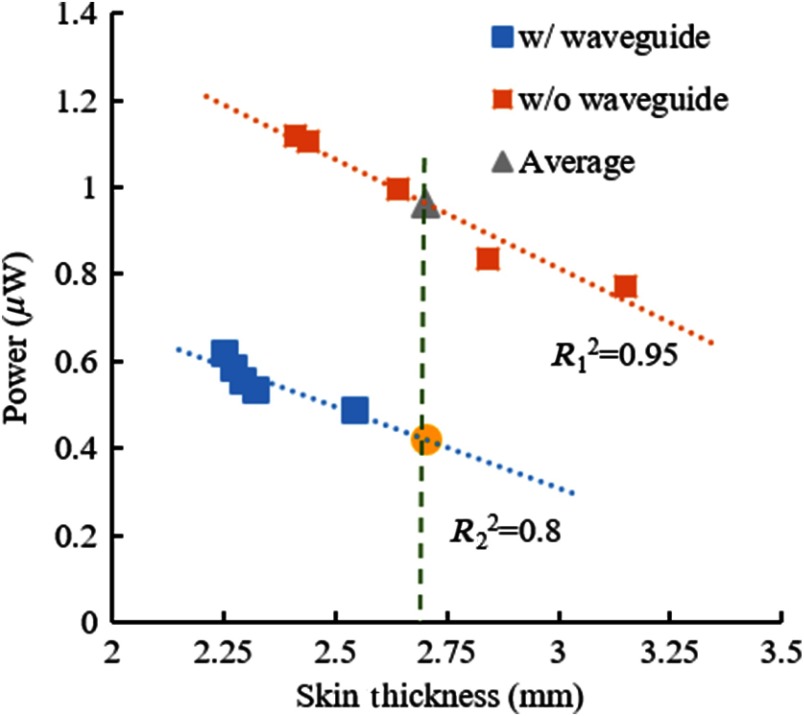
Five measurements were taken from each hand, first with the photodiode placed adjacent to the skin on the ventral side without the optical waveguide in between. These measurements were averaged as a representative of the light intensity transmitted through an average skin thickness for this particular hand (gray triangle in Fig. 4). Multiple-point measurement was deemed necessary to eliminate outliers due to the placement of the caliper across very thin or thick areas of the thenar skin. Five more measurements were made in each hand with the waveguide inserted between the hand and the photodiode as shown in Fig. 3. A linear line was fit to the measurements and the transmission at the same skin thickness that was found as the average thickness without the waveguide was calculated by interpolation/extrapolation (yellow dot in Fig. 4). The ratio of light transmission at the same skin thickness with and without the waveguide (yellow dot/gray triangle) was taken as the attenuation due to the waveguide, which in fact consisted of two parts. First, photons enter the optical waveguide in a very wide range of angles after passing through a scattering medium, such as the human skin. Some of these photons cannot be contained in the waveguide because of the large angle of entry. Second, light is attenuated along the waveguide due to absorption. We could factor out the latter by measuring this value separately with a collimated laser beam (Sec. 3.1), which eliminates the wide angle of entry. The net result was the light collection efficiency of the waveguide at the interface with the skin.
Fig. 4.
Representative plot for determination of percent transmission in the left hand of subject 10. Gray triangle: average power of five measurements without the waveguide, yellow dot: power value found by extrapolation from the measurements with the waveguide at the same mean skin thickness.12
2.4. Chronic Implantation of Polydimethylsiloxane Waveguides
2.4.1. Experimental setup
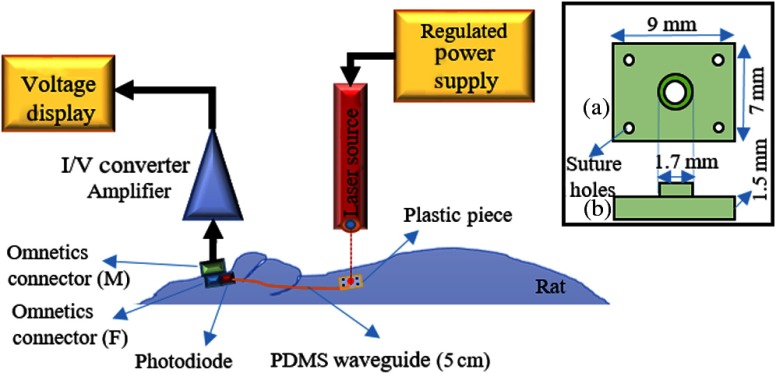
The cylindrical waveguides were cut at 5 cm lengths. A silicone photodiode ( active area) was attached to the proximal end, using the same type of silicone in the cladding, while the distal end was reeved from a pinhole centered on a plastic piece (1.5-mm thickness, see inset in Fig. 5). The photodiode’s terminals were soldered to two pins of an Omnetics connector to make current measurements with external electronics.
Fig. 5.
Experimental setup for chronic implantation of a PDMS waveguide. A 5-cm waveguide, the photodiode, the head connector, and a plastic piece to hold the waveguide were assembled together prior to implantation. Inset: drawing of the plastic piece; (a) top and (b) side views of the plastic piece.
The photodiode light collection measurements were made prior to implantation while the waveguide was placed in a straight position. The active area of the photodiode was rectangular shape that was smaller than the circular waveguide. The objective of this part was to assess the relative changes in light transmission after implantation. No attention was given to the absolute measurements of light since they greatly varied depending on the skin thickness and color.
2.4.2. Surgical procedure
Four Sprague Dawley (275 to 325 g, male) rats were used in this study. Under anesthesia 2% to 4% isoflurane anesthesia, an incision was made along the midline over the head and extended 5-cm caudally toward the neck. The connective tissue over the skull was removed to attach the Omnetics connector with dental acrylic. The waveguide was tunneled under the skin and the distal end was attached to the skin in the neck area, after removing the excess muscle and connective tissue, with the tip pointing in an outward direction. The plastic piece (inset in Fig. 5) holding the waveguide’s tip was sutured to the skin to mechanically stabilize the tip and its orientation. All experimental procedures were approved by the Animal Care Committee at Rutgers University, New Jersey.
2.4.3. Data collection in chronic implants
The current measurement was made twice a week after allowing 1 week for recovery. Under anesthesia, the light beam was aimed at the skin area where the distal end of the waveguide was located. The light source was a laser (Thorlabs, , ) coupled with a multimode glass fiber (Thorlabs, diameter , 0.39 NA). The light power at the other end of the waveguide was quantified with current measurements made through the Omnetics connector attached to the head. Measurements were made at the maximum light intensity when the laser beam was aligned with the waveguide tip.
3. Results
3.1. In Vitro Attenuation Measurements
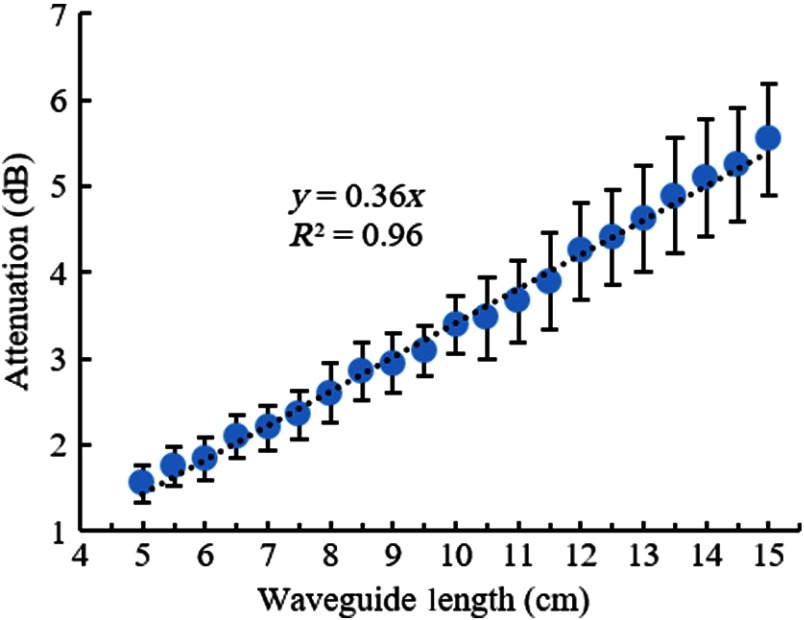
The cylindrical optical waveguides we prepared had an attenuation of (, , ) in straight positioning (Fig. 6), as indicated by a linear line fit to the mean of the measurements at each length. The largest source of variability in the measured values was most likely was due to the surface imperfections at the end of the waveguides after cutting with a razor blade each time.
Fig. 6.
Average attenuation of five cylindrical waveguides as a function of waveguide length in steps of 5 mm. Error bars: one-standard deviation. Dash line: linear fit with interception at 0,0.
3.2. Light Attenuation due to Bending in Air and Saline
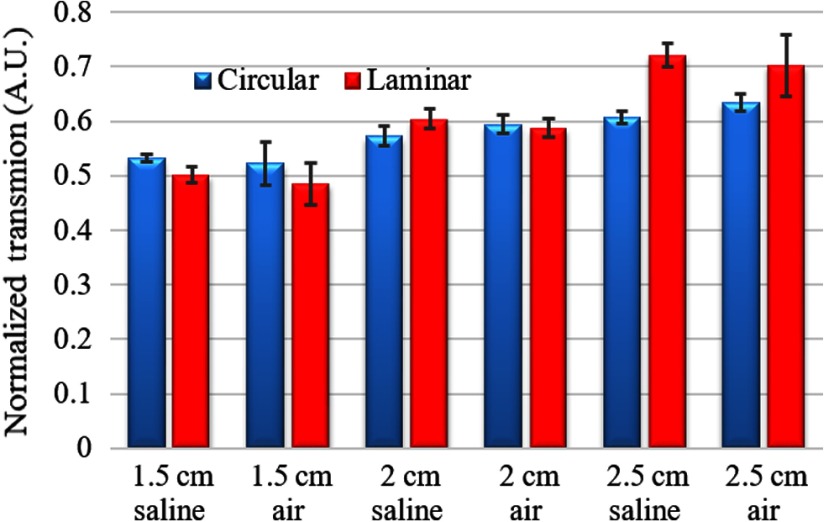
The bending attenuation of cylindrical and laminar waveguides were measured at different radii of curvature () of 180 deg bending, in air and 0.9% normal saline to study the effect of the refractive index of the medium. The results were normalized to the measurements made at straight positioning in air. Figure 7 shows the measurements made in air and saline from five different fibers of the same diameter and length at three different curvature radii (1.5, 2, and 2.5 cm), selected arbitrarily as possible scenarios that may occur after implantation. For circular design, the measured transmission with 2.5-cm radius in air is around 0.63 and decreases to 0.52 with 1.5-cm curvature radius (). The same measurements with the laminar design were 0.7 and 0.5, respectively, (). The presence of saline as a medium introduced a higher transmission but was not statistically different between saline–air pairs (). The laminar waveguide had slightly higher transmissions in saline than in air at all curvature radii (), which was not the case for the cylindrical design (). Overall, the difference in refractive indices of air and saline does not have a substantial influence on the confinement of light, as expected due to the presence of cladding.
Fig. 7.
Normalized transmission (with respect to straight position in air) of cylindrical and laminar waveguides bent 180 deg with varying radius of curvature (1.5, 2.0, and 2.5 cm) in air and saline. ( waveguides).
3.3. Transmission Through the Hand Skin
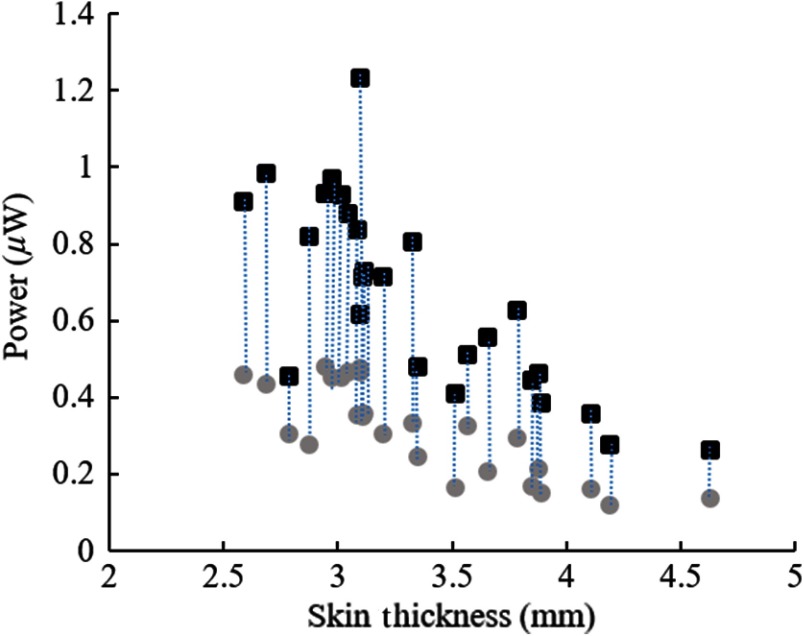
After being collimated through the pinhole, the incident light intensity falling upon the skin was . The light intensity that was transmitted through the skin and received directly by a 1.1-mm-diameter circular photodiode (without the waveguide) ranged between 0.3 to in different subjects while the skin thickness varied from 4.6 to 2.6 mm (squares in Fig. 8). This substantial attenuation of light intensity is mostly due to the scattering of photons inside the skin. The circles in Fig. 8 show the light intensities collected with the waveguide (also 1.1 mm diameter) inserted between the hand and the photodiode, after factoring out the attenuation along the waveguide that was reported in Fig. 6. Thus, the ratio of the circles over the squares in Fig. 8 gives the light collection efficiency of the waveguide in each case. The light collection efficiency averaged across all subjects (both hands) was found to be (), which was not significantly affected by the gender, the BMI, or skin pigmentation ( for all groups). Overall, the 5-cm-long waveguides of this study had a total efficiency of about 29% from the thenar skin to the end of the waveguide. This transmission efficiency was found as the product of 44% of collection efficiency and 66% of transmission along the waveguide, which is equivalent to 1.8 dB () of attenuation.
Fig. 8.
Light intensity measurements with the waveguide in place (circles) and hand alone without the waveguide (squares) as a function of thenar skin thickness (52 data points from left and right hands of 13 subjects). Vertical dash lines connect the measurement pairs from the same hand.
The local hand temperature remained the same in all the subjects during data collection due to the low levels of light power. The maximum change detected was 0.1°C, which is considered within the body maintaining temperature.39
3.4. Transmission Through Rat Skin
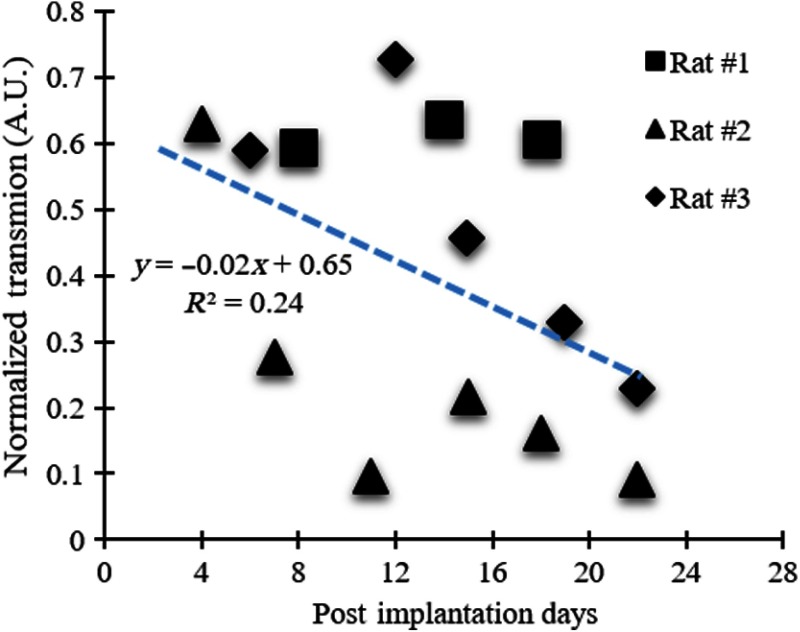
The total power of the incident light beam aimed at the skin was . The beam was pointed at the center of the implanted waveguide tip where the normalized light transmission efficiency had a mean of 39% and standard deviation during the 4 weeks implant time in three animals. The rat skin thickness was measured to be around 2 mm at the point of beam entry around the neck area during the surgery prior to suturing the plastic piece. Figure 9 shows light transmissions normalized by the in-air measurements made before implantation. The normalized transmissions show a decreasing trend over the 4 weeks period. This may be due to the growth of connective tissue around the tip of the waveguide, or the plastic piece that is sutured to the skin may be constricting the blood supply to the area and causing fibrosis of the skin. Intersubject variability was relatively high at the time points that the measurements were made. This may be due to the changes in waveguide’s shape and position inside the tissue. The waveguide had to make a turn for its tip to stay perpendicular to the skin, and this curvature might have changed during the course of the implantation period and caused some of the variability in light transmission.
Fig. 9.
Normalized transmission for three chronically implanted waveguides as a function of postimplantation days. Blue-dash line: linear fit ().
3.5. Histology of Rat Skin
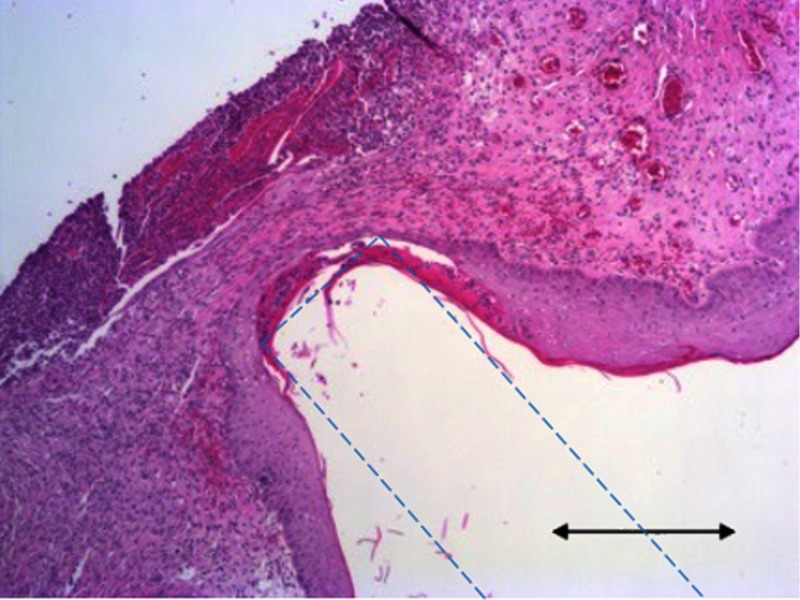
Skin samples were collected after termination and hematoxylin and eosin (H&E) staining was performed according to protocol provided by Leica multistainer bath array ST5020 (Leica Biosystems). The sample image in Fig. 10 shows that the tissue around the waveguide tip was densely populated with fibroblast and cell nuclei, which suggested that there was an on-going inflammatory response at the end of a 1-month implantation time. A technique to better attach the waveguide tip to the skin that will minimize the relative motion, without compromising the blood circulation, is needed in the future to obtain more stable optical measurements in vivo.
Fig. 10.
Representative hematoxylin and eosinH&E-stained skin sample taken around the tip of the cylindrical PDMS waveguide where the large indentation is. Blue-dash line: estimated waveguide boundaries, .
4. Discussion
The main objective of this study was to characterize the light transmission efficiencies of PDMS waveguides, first on the bench and then investigate their light collection efficiencies through animal and human skin. About 44% of the photons were collected after being scattered through the human skin with PDMS waveguides. We made measurements of collected photons with and without the waveguide between the thenar skin and the photodiode. The photodiode converts the incoming photons falling upon its surface in all directions into electron/hole pairs, whereas the waveguide can contain only those photons entering it within a certain receiving angle. The ratio of these two measurements gives the photon collection efficiency of the waveguide through the skin, a light-scattering medium. The assumption here is that once the photons travel a sufficient distance through the scattering medium, the distribution of photon density as a function of direction will be more or less uniform. Then, the collection efficiency should be independent of the skin thickness, despite the fact that transmitted light intensity will decrease quickly with thicker skin. The attenuation through the skin was factored out in these measurements so that the results reflect only the collection efficiency at the tissue–waveguide interface. The 44% value measured here in human subjects provides a useful reference point, although the experimental paradigm does not mimic the case of an actual implant. Our sample size is not large enough to draw conclusions regarding the collection efficiencies or the skin attenuations in subjects with different skin pigmentations.
4.1. Light Attenuation: Sample Calculations
The thenar skin flap was chosen only for convenience. Human skin varies in thickness around the body. The skin flap overlying a cochlear implant was estimated to be around 5 to 7 mm ( quartiles, total of 18 men and 17 women) before implantation,40 whereas the flexor aspect of the forearm skin was found to be only in males () and 0.73 mm in females (), and it slightly deceased by age.41 The thickness of the dermis in the back ranged from in Caucasians42 to 43 in Koreans. Nonetheless, it is the epidermis, the waterproof, tough layer of tissue, that keeps out the bacteria and viruses, which measures around 62 to in the human back skin of the same populations42,43 and can be as thin as 40 to over the abdomen in Caucasians.42,44 This very thin layer of dead cells is the primary protection mechanism of the body against infection. Thus, it is theoretically possible to implant an optical fiber with the tip as close as a few hundred microns underneath the skin surface without breaching the epidermis. The light transmission through the epidermis alone changes between 63% and 86.5%, measured at 675 nm.45 Another group reported 58% and 67% transmissions at 633 and 820 nm wavelengths, respectively, through the human epidermis and some of the dermis at a depth of 0.4 mm.46 Another factor that will determine the amount of transmitted light is the cross-sectional area of the optical waveguide. A rough calculation shows that a cylindrical waveguide with a cross-sectional area of can collect about 1.23 mW at the MPE limit of , assuming a 70% transmission through the epidermis and a collection efficiency of 44% by the waveguide. The light intensity would be further attenuated by about 0.36 dB (92% is transmitted) for every centimeter of the PDMS waveguide length according to our measurements. As an example, this translates into a 1.08-dB loss (78% transmission) for a waveguide that is 30 mm long. Then, the optical power that can be harvested at 30 mm from the skin surface is estimated to be about using our waveguide approach proposed in this paper. A larger caliber waveguide would collect and transmit proportionally more optical power, while additional attenuation () should be factored in for longer waveguides. Light attenuations by similar PDMS materials were previously reported to be around 0.4 to .32,47,48 Fabrication techniques can be improved to achieve particularly blemish-free PDMS surfaces and hence better confinement of light inside the waveguide. Such imperfections will have a greater effect when the waveguide is bent, twisted, or stretched.
4.2. Wireless Spinal Cord Microstimulation
Wireless microstimulation of the spinal cord will be discussed here as a potential application of optical waveguides. In a human, the distance from the surface of the back skin to the epidural space may vary depending on the gender, age, and BMI. The average distance for vertebral segments of C5 through T1 varied from 4.7 to 5.6 cm in males and from 4.0 to 5.0 cm in females in Chinese and Korean adult populations.49,50 One possible scenario of wireless stimulation is to place the energy harvester subcutaneously and transmit the electric current via conductive wires to the neural electrode or the electronics as shown in Fig. 11(a), which is the approach taken in most wireless implantable sensors and neural prosthetics.51 In these schemes, there will be a bundle of wires or at least a pair of wires, depending on where the electronics are located, that are tethered on the spinal electrode.
Fig. 11.
Potential wireless spinal cord stimulation approaches: (a) RF method with a subcutaneous receiving coil and a wired connection to the implanted MEA, (b) acoustic method targeted to a floating MEA with electronics and energy harvester implanted intradurally, and (c) transcutaneous light collected with a waveguide and transmitted to a floating MEA with electronics and a photodiode as the energy harvester on the spinal cord.
The spinal cord experiences substantial rotational and longitudinal displacements along with the vertebral column, especially at the cervical level.20–22 In a large group of healthy subjects (3547), the mean cervical range of motion (maximum flexion angle) was found to be about 33 deg laterally, and in the frontal direction while the mean value of maximal neck rotation was 63 deg.21 The location of the instant center of rotation (ICR) between adjacent cervical vertebrae was proposed as a measure of combined relative translation and rotation that occur during flexion-extension of the neck. In 20 asymptomatic subjects, the ICR location moved by 0.5 mm on average (0.1 to 0.8 mm 95% confidence interval) per degree of flexion/extension of the neck at the C6/C7 segmental border, and this value progressively increased to 3.9 mm (3.2- to 4.7-mm confidence interval) at the C2/C3 level.20
The first prerequisite for a chronic implantable spinal cord microstimulator is that it must be completely free of any anchors or attachments to the surrounding structures that move with respect to the spinal cord. This implies that the energy harvester has to be put directly on the spinal electrode, as shown in Fig. 11(b), to allow it to float freely. In this case, we will have to transmit the energy wirelessly through the tissue and focus it at the targeted receiver. Moving the energy harvester to the spinal electrode from a subcutaneous location will also allow intradural placement of the stimulating electrodes, as opposed to the epidural approach. The human spinal cord floats inside a few millimeters of cerebrospinal fluid, which not only makes selective activation with epidural stimulation leads a challenging task but also causes the stimulus threshold to change as the body moves with respect to gravity. A Medtronic supported clinical trial has reported that automatic position-adaptive spinal cord stimulation, which uses a three-axis accelerometer for automatic adjustment of stimulus amplitude as a compensation mechanism for changing body positions, provides improved pain relief to the subject.20,52,53 The current shunting effect of the cerebrospinal fluid is drastically seen in a recent simulation study where intradural placement of the leads introduced a 90% reduction in the stimulus amplitude.54 The intradural placement of the electrodes is the favored scenario here for a wireless spinal cord stimulation device for implant longevity and minimizing the chronic tissue response. Next, electromagnetic and acoustic techniques will be discussed as potential alternatives for wireless power and telemetry.
4.3. Electromagnetic Technique
The Federal Communications Commission (FCC) states that the specific absorption rate (SAR) associated with electromagnetic exposure of the human head should not exceed even locally.55 The size of the electromagnetic receiving coil is inversely proportional to its resonance frequency whereas the tissue absorption of electromagnetic energy increases with frequency. Thus, maximizing the energy harvested inside the living tissue without exceeding the SAR limitation becomes an optimization problem of finding the optimum frequency for a given antenna size. Zhao et al.50 predicted that the maximum electromagnetic power that can be collected with a 5-mm antenna placed on the cortical surface (20 mm below the skin surface) is at the resonance frequency of the coil (2.07 GHz, their Fig. 4), and it decays by depth. Larger antenna sizes can collect more power at frequencies lower than the resonance frequency; however, they would not be feasible to be placed near the cord without imposing significant risk of neural injury. Ho et al.56 used the midfield powering technique to form a high-energy density region deep inside the tissue in order to circumvent the problem of exponentially decaying field strength obtained with near-field coupled coils. They were able to harvest at 4 cm into a porcine head using a 2-mm receiving antenna with an exposure level of at the surface. If we scale these results to the SAR limit of , we find , which is a substantial improvement over the near-field technique. If we adopt the SAR limit () assumed by IEEE,57 the same value becomes . Although the human head and the spinal cord have different anatomical features, this report provides a general idea about the electromagnetic power levels that can be transmitted wirelessly deep into tissue where there is a bony structure and soft tissue in the path.
4.4. Acoustic Method
As in the electromagnetic approach, the acoustic method below certain frequencies is also not practical for implantable microdevices because the transducer thickness that can resonate increases exponentially with decreasing frequencies from submillimeter to several millimeters. On the higher end, acoustic energy loss in the tissue also increases with frequency and severely limits the implantation depth at frequencies above a few MHz while focusing may be easier. Ozeri and Shmilovitz58 suggested 0.2 to 1.2 MHz as the optimum range of acoustic frequencies to maximize the transcutaneous power delivery to an implant. Although the skin and the underlying soft tissue layers have acoustic impedances and phase velocities that are close to those in water, attenuation of the pressure field by tissue is much higher than water attenuation (soft tissue 0.6 to compared to water at 1 MHz).58–60 The acoustic signal intensity depends on the pressure squared, and thus, it decreases at twice the rate of pressure. Assuming a moderate level attenuation of for the pressure at medium frequencies, the signal power will be halved () at every 30 mm from the surface. In practice, the experimentally measured transmission efficiencies were at a depth of 30-mm inside pig muscle tissue at the resonance frequency of 673 kHz using a 15 mm (3-mm thickness) circular piezoelectric receiver, when the transmitter and receiver were aligned perfectly.58 The FDA’s safety requirements limit the acoustic intensity to for abdominal and other tissues, excluding the ophthalmic ones.61,62 In the report above, if we scale the received acoustic power down for a 2-mm circular device, it would be 56 times smaller, i.e., (), assuming the same receiver thickness and resonance frequency. This number is in the same ballpark with that of the RF transmission (midfield) with similar receiver sizes at a depth of 4 cm. As in the electromagnetic approach, the main difficulty with acoustic energy harvesting is that the efficiency declines quickly if the receiver shifts off the acoustic beam center or rotates around its own axis, which may be difficult to control in a spinal implant.
4.5. Comparative Analysis
The optical energy that can be transmitted to a depth of 30 mm using a waveguide () is in the same ballpark power range with that of the acoustic () and electromagnetic techniques ( or ) as estimated above. However, the attenuation of acoustic signals in soft tissue (twice the pressure attenuation of 0.6 to )60,63 is much higher than the attenuation along our optical waveguides (). This suggests that the waveguide approach will progressively do better at deeper implant locations. More importantly, the acoustic waves will be attenuated drastically passing through the vertebral bones whereas the optical waveguide may be inserted between the vertebrae or through a small hole made into the bone [Fig. 11(c)]. Moreover, beyond the Rayleigh distance where the far field starts, the acoustic pressure intensity decays exponentially with distance.64 For instance, for a source radius of 7.5 mm and the frequency of 673 kHz, the Rayleigh distance is 25 mm.58 The electromagnetic technique can also deliver significant levels of power if we use the most recent IEEE guidelines on SAR () rather than those by FCC (). However, the midfield method of focusing the electromagnetic energy in small volumes of tissue will be highly sensitive to rotational and translational displacements of the spinal cord and quickly lose its efficiency in case of misalignment.
Although the photon collection efficiency of a photodiode is not very dependent on the receiving angle, as in the other two cases, the optical approach also requires some level of alignment between the waveguide tip and the implanted photodiode that is used as the energy converter. As shown in Fig. 11(c), the photons will exit the waveguide with the same angles as they entered the waveguide. Thus, the photodiode photon-receiving area has to be larger than the waveguide cross-sectional area in order to account for this diversion of the photons as they travel through the cerebrospinal fluid as well as to accommodate the movements of the spinal cord. By making the photodiode surface area larger than the beam size, the optical approach would be much less likely to suffer from efficiency losses due to alignment problems with the energy harvester implanted on the spinal cord. With the optical approach, the major caveat is bending and twisting of the waveguide, which will introduce further attenuation in light intensity. In the worst case scenario, if the waveguide is bent as much as 180 deg inside the subject, more than 50% of the power will be available compared to the straight position according to the plots in Fig. 6. The attenuation will be very small or negligible across the cerebrospinal fluid because it is a clear solution. The optical attenuation through the human dura, however, needs to be measured in future studies.
In all three forms of energy, once the energy is harvested by the receiver, the conversion efficiency to an electric current can be quite high. Both the mechanoelectric conversion efficiency of piezoelectric materials and the quantum efficiency of photodiodes (in 700 to 900 nm) is ∼90% or higher.
4.6. Summary of Discussion
Both acoustic and electromagnetic energy can penetrate deeper into living tissue than the optical form of energy. Unlike the other two, however, optical energy can be transmitted via waveguides or optical fibers with far smaller attenuation per unit depth. The electromagnetic energy decays exponentially and can only be useful for wireless systems where the energy-harvesting devices are beneath the skin or the skull. The acoustic energy is capable of penetrating much deeper into the tissue and providing significant levels of power up to a few cm. For deeper implants, the optical waveguides seems to be a better choice, especially if there are bony structures, such as the spinal column or the skull, in the path.
Other advantages of the optical powering scheme proposed here include being free from electromagnetic signal emission that may interfere with other communication devices around. The generation of optical signals using semiconductor lasers takes less space than acoustic devices or RF electromagnetic sources with an external antenna coil at comparable power levels. PDMS waveguides may also find applications in optical stimulation of cochlea,65–67 optogenetic neural stimulation,68 and deep brain stimulation.69 A soft optical fiber may also be preferred for imaging of deep brain areas in the experimental animals70 in order to minimize the damage to the surrounding neural tissue.
5. Conclusion
This paper presents supporting evidence for a method of using optical waveguides for powering and telemetry applications for implantable neural electrodes. The results suggest that light energy can be collected transcutaneously and transmitted to deeper locations inside neural or other tissues using PDMS waveguides with less attenuation per depth compared to acoustic or electromagnetic approaches. Based on our data and other reports, we predict that this approach can provide higher power levels while staying within the federally regulated limits of energy exposure on human body, than the electromagnetic and acoustic methods for floating devices implanted deeper than a few centimeter. These design criteria match the anatomical and technical requirements, for instance, from a spinal cord microstimulating device for humans. For applications demanding higher power levels, the cross-sectional area of the waveguide can always be increased, if some of the waveguide flexibility can be sacrificed. A highly flexible and biocompatible optical waveguide combined with the high conversion efficiency of semiconductor photoelectric devices can offer many advantages for powering and wireless telemetry of spinal cord and brainstem microstimulators.
Acknowledgments
This study was supported by the National Institute of Health Grant (NINDS, R01 NS0785). Author, AE was affiliated with UNTHSC, Fort Worth, Texas at the time this paper was submitted.
Biographies
Ali Ersen received his PhD in biomedical engineering from the New Jersey Institute of Technology/Rutgers University Biomedical and Health Sciences, New Jersey, USA. His research interest is development of devices and technologies for individuals who have neurological disorders and disabilities. Currently, he is holding a position as a postdoctoral research associate at the University of North Texas Health Science Center, where he is investigating the clinical implications of plantar pressure and temperature distribution in diabetic foot ulcers.
Mesut Sahin received his MS and PhD degrees in biomedical engineering from Case Western Reserve University in 1993 and 1998, respectively. He joined Louisiana Tech University as an assistant professor in 2001. He has been with the biomedical engineering faculty at the New Jersey Institute of Technology since 2005 with promotion to full professor in 2015. His research interest is mainly in the development of innovative neural prosthetics. He is an associate editor at IEEE Transaction on BioCAS and senior meber at IEEE/Engineering in Medicine & Biology Society.
Disclosures
Mesut Sahin and Ali Ersen declare no conflicts of interest regarding this paper.
References
- 1.Campbell P. K., et al. , “A silicon-based, three-dimensional neural interface: manufacturing processes for an intracortical electrode array,” IEEE Trans. Biomed. Eng. 38, 758–768 (1991). 10.1109/10.83588 [DOI] [PubMed] [Google Scholar]
- 2.Davis T. S., et al. , “Restoring motor control and sensory feedback in people with upper extremity amputations using arrays of 96 microelectrodes implanted in the median and ulnar nerves,” J. Neural Eng. 13, 036001 (2016). 10.1088/1741-2560/13/3/036001 [DOI] [PubMed] [Google Scholar]
- 3.Hassler C., et al. , “Intracortical polyimide electrodes with a bioresorbable coating,” Biomed. Microdevices 18, 81 (2016). 10.1007/s10544-016-0106-7 [DOI] [PubMed] [Google Scholar]
- 4.Schwarz D. A., et al. , “Chronic, wireless recordings of large-scale brain activity in freely moving rhesus monkeys,” Nat. Methods 11, 670–676 (2014). 10.1038/nmeth.2936 [DOI] [PMC free article] [PubMed] [Google Scholar]
- 5.Vetter R. J., et al. , “Chronic neural recording using silicon-substrate microelectrode arrays implanted in cerebral cortex,” IEEE Trans. Biomed. Eng. 51, 896–904 (2004). 10.1109/TBME.2004.826680 [DOI] [PubMed] [Google Scholar]
- 6.Biran R., Martin D. C., Tresco P. A., “The brain tissue response to implanted silicon microelectrode arrays is increased when the device is tethered to the skull,” J. Biomed. Mater. Res. A 82, 169–178 (2007). 10.1002/(ISSN)1552-4965 [DOI] [PubMed] [Google Scholar]
- 7.Perge J. A., et al. , “Intra-day signal instabilities affect decoding performance in an intracortical neural interface system,” J. Neural Eng. 10, 036004 (2013). 10.1088/1741-2560/10/3/036004 [DOI] [PMC free article] [PubMed] [Google Scholar]
- 8.Sridharan A., Rajan S. D., Muthuswamy J., “Long-term changes in the material properties of brain tissue at the implant-tissue interface,” J. Neural Eng. 10, 066001 (2013). 10.1088/1741-2560/10/6/066001 [DOI] [PMC free article] [PubMed] [Google Scholar]
- 9.Alex M. A., et al. , “Mechanical failure of the electrode wire in deep brain stimulation,” Parkinsonism Relat. Disord. 10, 153–156 (2004). 10.1016/j.parkreldis.2003.11.001 [DOI] [PubMed] [Google Scholar]
- 10.Sahin M., Pikov V., “Wireless microstimulators for neural prosthetics,” Crit. Rev. Biomed. Eng. 39, 63–77 (2011). 10.1615/CritRevBiomedEng.v39.i1 [DOI] [PMC free article] [PubMed] [Google Scholar]
- 11.Bilro L., et al. , “Optical sensors based on plastic fibers,” Sensors 12, 12184–12207 (2012). 10.3390/s120912184 [DOI] [PMC free article] [PubMed] [Google Scholar]
- 12.Ersen A., Sahin M., “A PDMS-based optical waveguide for transcutaneous powering of microelectrode arrays,” in IEEE 38th Annual Int. Conf. of the Engineering in Medicine and Biology Society (EMBC 2016), pp. 4475–4478 (2016). 10.1109/EMBC.2016.7591721 [DOI] [PMC free article] [PubMed] [Google Scholar]
- 13.Ersen A., Sahin M., “PDMS-based optical conduit for powering untethered neural microstimulators,” in presented at the Minnesota Neuromodulation Symp., University of Minnesota; (2015). [Google Scholar]
- 14.Sahin M., Ersen A., “Biocompatible and implantable optical conduits,” US Patent App. 15/098, 497 (2016).
- 15.Kim S. H., et al. , “Flexible, stretchable and implantable PDMS encapsulated cable for implantable medical device,” Biomed. Eng. Lett. 1, 199–203 (2011). 10.1007/s13534-011-0033-8 [DOI] [Google Scholar]
- 16.Hassler C., Boretius T., Stieglitz T., “Polymers for neural implants,” J. Polym. Sci., Part B: Polym. Phys. 49, 18–33 (2011). 10.1002/polb.22169 [DOI] [Google Scholar]
- 17.Colletti V., “Auditory outcomes in tumor vs. nontumor patients fitted with auditory brainstem implants,” Adv. Otorhinolaryngol. 64, 167–185 (2006). 10.1159/000094651 [DOI] [PubMed] [Google Scholar]
- 18.Lenarz M., et al. , “Auditory midbrain implant: histomorphologic effects of long-term implantation and electric stimulation of a new deep brain stimulation array,” Otol. Neurotol. 28, 1045–1052 (2007). 10.1097/MAO.0b013e318159e74f [DOI] [PubMed] [Google Scholar]
- 19.Lim H. H., et al. , “Electrical stimulation of the midbrain for hearing restoration: insight into the functional organization of the human central auditory system,” J. Neurosci. 27, 13541–13551 (2007). 10.1523/JNEUROSCI.3123-07.2007 [DOI] [PMC free article] [PubMed] [Google Scholar]
- 20.Anderst W., et al. , “Motion path of the instant center of rotation in the cervical spine during in vivo dynamic flexion-extension: implications for artificial disc design and evaluation of motion quality after arthrodesis,” Spine 38, E594–E601 (2013). 10.1097/BRS.0b013e31828ca5c7 [DOI] [PMC free article] [PubMed] [Google Scholar]
- 21.Kauther M. D., et al. , “Cervical range of motion and strength in 4, 293 young male adults with chronic neck pain,” Eur. Spine J. 21, 1522–1527 (2012). 10.1007/s00586-012-2369-x [DOI] [PMC free article] [PubMed] [Google Scholar]
- 22.Panjabi M. M., “The stabilizing system of the spine. Part II. Neutral zone and instability hypothesis,” J. Spinal Disord. 5, 390–397 (1992). 10.1097/00002517-199212000-00002 [DOI] [PubMed] [Google Scholar]
- 23.Guo Y., et al. , “Encoding of forelimb forces by corticospinal tract activity in the rat,” Front. Neurosci. 8, 62 (2014). 10.3389/fnins.2014.00062 [DOI] [PMC free article] [PubMed] [Google Scholar]
- 24.Holinski B. J., et al. , “Intraspinal microstimulation produces over-ground walking in anesthetized cats,” J. Neural Eng. 13, 056016 (2016). 10.1088/1741-2560/13/5/056016 [DOI] [PMC free article] [PubMed] [Google Scholar]
- 25.Ersen A., et al. , “Chronic tissue response to untethered microelectrode implants in the rat brain and spinal cord,” J. Neural Eng. 12, 016019 (2015). 10.1088/1741-2560/12/1/016019 [DOI] [PMC free article] [PubMed] [Google Scholar]
- 26.I. American National Standards, A. Laser Institute of, and I. American National Standards, American National Standard for Safe Use of Lasers, Laser Institute of America, Orlando, Florida: (2014). [Google Scholar]
- 27.Ersen A., Abdo A., Sahin M., “Temperature elevation profile inside the rat brain induced by a laser beam,” J. Biomed. Opt. 19, 015009 (2014). 10.1117/1.JBO.19.1.015009 [DOI] [PMC free article] [PubMed] [Google Scholar]
- 28.Ratner B. D., et al. , Eds., “Introduction–biomaterials science: an evolving, multidisciplinary endeavor,” in Biomaterials Science, 3rd ed, pp. 25–37, Academic Press, Cambridge: (2013). [Google Scholar]
- 29.Yu N., Polycarpou A. A., Wagoner Johnson A. J., “Measuring mechanical properties of fine-wire cross-sections used in medical devices,” J. Biomed. Mater. Res. B Appl. Biomater. 70, 106–113 (2004). 10.1002/(ISSN)1097-4636 [DOI] [PubMed] [Google Scholar]
- 30.Wallenberger F. T., Bingham P. A., Fiberglass and Glass Technology: Energy-Friendly Compositions and Applications, Springer, New York: (2010). [Google Scholar]
- 31.Gaso P., et al. , “Fabrication of optical waveguide structures based on PDMS using photoresist fibers,” Proc. SPIE 9441, 944118 (2014). 10.1117/12.2175903 [DOI] [Google Scholar]
- 32.Martincek I., Pudis D., Chalupova M., “Technology for the preparation of PDMS optical fibers and some fiber structures,” IEEE Photonics Technol. Lett. 26, 1446–1449 (2014). 10.1109/LPT.2014.2326695 [DOI] [Google Scholar]
- 33.Schneider F., et al. , “Process and material properties of polydimethylsiloxane (PDMS) for optical MEMS,” Sens. Actuators A 151, 95–99 (2009). 10.1016/j.sna.2009.01.026 [DOI] [Google Scholar]
- 34.Valouch S., et al. , “Direct fabrication of PDMS waveguides via low-cost DUV irradiation for optical sensing,” Opt. Express 20, 28855–28861 (2012). 10.1364/OE.20.028855 [DOI] [PubMed] [Google Scholar]
- 35.“DOW Corning® OE-6550 optical encapsulant,” http://www.dowcorning.com/applications/search/products/details.aspx?prod=04066832&type=PROD (12 January 2017).
- 36.“SYLGARD® 184 Silicone Elastomer Kit,” http://www.dowcorning.com/applications/search/products/Details.aspx?prod=01064291 (12 January 2017).
- 37.Tuchin V. V., “Tissue optics and photonics: light-tissue interaction,” J. Biomed. Photonics Eng. 1(2), 98–135 (2015). [Google Scholar]
- 38.Fitzpatrick T. B., “The validity and practicality of sun-reactive skin types I through VI,” Arch. Dermatol. 124, 869–871 (1988). 10.1001/archderm.1988.01670060015008 [DOI] [PubMed] [Google Scholar]
- 39.Axelrod Y. K., Diringer M. N., “Temperature management in acute neurologic disorders,” Neurol. Clin. 26, 585–603 (2008). 10.1016/j.ncl.2008.02.005 [DOI] [PubMed] [Google Scholar]
- 40.Raine C. H., et al. , “Skin flap thickness in cochlear implant patients–a prospective study,” Cochlear Implants Int. 8, 148–157 (2007). 10.1179/cim.2007.8.3.148 [DOI] [PubMed] [Google Scholar]
- 41.Tan C. Y., et al. , “Skin thickness measurement by pulsed ultrasound: its reproducibility, validation and variability,” Br. J. Dermatol. 106, 657–667 (1982). 10.1111/j.1365-2133.1982.tb14702.x [DOI] [PubMed] [Google Scholar]
- 42.Southwood W. F., “The thickness of the skin,” Plast. Reconstr. Surg. 15, 423–429 (1955). 10.1097/00006534-195505000-00006 [DOI] [PubMed] [Google Scholar]
- 43.Lee Y., Hwang K., “Skin thickness of Korean adults,” Surg. Radiol. Anat. 24, 183–189 (2002). 10.1007/s00276-002-0034-5 [DOI] [PubMed] [Google Scholar]
- 44.Artz C. P., et al. , Burns: A Team Approach, Saunders, Philadelphia: (1979). [Google Scholar]
- 45.Kolárová H., Ditrichová D., Wagner J., “Penetration of the laser light into the skin in vitro,” Lasers Surg. Med. 24, 231–235 (1999). [DOI] [PubMed] [Google Scholar]
- 46.Kolari P. J., “Penetration of unfocused laser light into the skin,” Arch. Dermatol. Res. 277, 342–344 (1985). 10.1007/BF00509097 [DOI] [PubMed] [Google Scholar]
- 47.Cai D. K., et al. , “Optical absorption in transparent PDMS materials applied for multimode waveguides fabrication,” Opt. Mater. 30, 1157–1161 (2008). 10.1016/j.optmat.2007.05.041 [DOI] [Google Scholar]
- 48.Chang-Yen D. A., Eich R. K., Gale B. K., “A monolithic PDMS waveguide system fabricated using soft-lithography techniques,” J. Lightwave Technol. 23, 2088–2093 (2005). 10.1109/JLT.2005.849932 [DOI] [Google Scholar]
- 49.Han K. R., et al. , “Distance to the adult cervical epidural space,” Reg. Anesth. Pain Med. 28, 95–97 (2003). 10.1097/00115550-200303000-00004 [DOI] [PubMed] [Google Scholar]
- 50.Zhao Q., et al. , “The distance from skin to cervical and high thoracic epidural space on Chinese adults as read from MRI,” Pain Physician 17, 163–168 (2014). [PubMed] [Google Scholar]
- 51.Ben Amar A., Kouki A. B., Cao H., “Power approaches for implantable medical devices,” Sensors 15, 28889–28914 (2015). 10.3390/s151128889 [DOI] [PMC free article] [PubMed] [Google Scholar]
- 52.Davis J. P., Sahasrabudhe R. M., Simons D., “Posture-responsive therapy system with input means for redefining posture zones,” Google Patents (2011).
- 53.Schultz D. M., et al. , “Sensor-driven position-adaptive spinal cord stimulation for chronic pain,” Pain Physician 15(1), 1–12 (2012). [PubMed] [Google Scholar]
- 54.Howell B., Lad S. P., Grill W. M., “Evaluation of intradural stimulation efficiency and selectivity in a computational model of spinal cord stimulation,” PLoS One 9, e114938 (2014). 10.1371/journal.pone.0114938 [DOI] [PMC free article] [PubMed] [Google Scholar]
- 55.Federal Communications Commission Office of Engineering & Technology, Evaluating Compliance with FCC Guidelines for Human Exposure to Radiofrequency Electromagnetic Fields, OET Bulletin 65 (1997).
- 56.Ho J. S., et al. , “Wireless power transfer to deep-tissue microimplants,” Proc. Natl. Acad. Sci. U. S. A. 111, 7974–7979 (2014). 10.1073/pnas.1403002111 [DOI] [PMC free article] [PubMed] [Google Scholar]
- 57.“IEEE standard for safety levels with respect to human exposure to radio frequency electromagnetic fields, 3 kHz to 300 GHz,” IEEE Std C95.1-2005 (Revision of IEEE Std C95.1-1991), pp. 1–238, IEEE, New York: (2006). [Google Scholar]
- 58.Ozeri S., Shmilovitz D., “Simultaneous backward data transmission and power harvesting in an ultrasonic transcutaneous energy transfer link employing acoustically dependent electric impedance modulation,” Ultrasonics 54, 1929–1937 (2014). 10.1016/j.ultras.2014.04.019 [DOI] [PubMed] [Google Scholar]
- 59.Browne J. E., et al. , “Assessment of the acoustic properties of common tissue-mimicking test phantoms,” Ultrasound Med. Biol. 29, 1053–1060 (2003). 10.1016/S0301-5629(03)00053-X [DOI] [PubMed] [Google Scholar]
- 60.Duck F. A., Baker A. C., Starritt H. C., Ultrasound in Medicine, CRC Press, Boca Raton, Florida: (1998). [Google Scholar]
- 61.Barnett S. B., Kossoff G., Edwards M. J., “International perspectives on safety and standardization of diagnostic pulsed ultrasound in medicine,” Ultrasound Obstet. Gynecol. 3, 287–294 (1993). 10.1046/j.1469-0705.1993.03040287.x [DOI] [PubMed] [Google Scholar]
- 62.“Guidance for industry and FDA staff—information for manufacturers seeking marketing clearance of diagnostic ultrasound systems and transducers,” 2008, http://www.fda.gov/MedicalDevices/DeviceRegulationandGuidance/GuidanceDocuments/ucm070856.htm (26 January 2017).
- 63.Huisman H., “Diagnostic ultrasound: physics and equipment,” Ultrasound Med. Biol. 30, 1011 (2004). 10.1016/j.ultrasmedbio.2004.05.002 [DOI] [Google Scholar]
- 64.Carson P. L., “Biomedical ultrasonics. By P.N.T. Wells, Ph.D., Academic Press, Inc. London, copyright 1977. 635 pages. $46.90,” J. Clin. Ultrasound 6, 126–127 (1978). 10.1002/(ISSN)1097-0096 [DOI] [Google Scholar]
- 65.Duke A. R., et al. , “Spatial and temporal variability in response to hybrid electro-optical stimulation,” J. Neural Eng. 9, 036003 (2012). 10.1088/1741-2560/9/3/036003 [DOI] [PMC free article] [PubMed] [Google Scholar]
- 66.Rajguru S. M., et al. , “Optical cochlear implants: evaluation of surgical approach and laser parameters in cats,” Hear. Res. 269, 102–111 (2010). 10.1016/j.heares.2010.06.021 [DOI] [PMC free article] [PubMed] [Google Scholar]
- 67.Thompson A. C., Stoddart P. R., Jansen E. D., “Optical stimulation of neurons,” Curr. Mol. Imaging 3, 162–177 (2014). 10.2174/2211555203666141117220611 [DOI] [PMC free article] [PubMed] [Google Scholar]
- 68.Mohanty S. K., Lakshminarayananan V., “Optical techniques in optogenetics,” J. Mod. Opt. 62, 949–970 (2015). 10.1080/09500340.2015.1010620 [DOI] [PMC free article] [PubMed] [Google Scholar]
- 69.Lee S. T., et al. , “A miniature, fiber-coupled, wireless, deep-brain optogenetic stimulator,” IEEE Trans. Neural Syst. Rehabil. Eng. 23, 655–664 (2015). 10.1109/TNSRE.2015.2391282 [DOI] [PubMed] [Google Scholar]
- 70.Jercog P., Rogerson T., Schnitzer M. J., “Large-scale fluorescence calcium-imaging methods for studies of long-term memory in behaving mammals,” Cold Spring Harbor Perspect. Biol. 8, a021824 (2016). 10.1101/cshperspect.a021824 [DOI] [PMC free article] [PubMed] [Google Scholar]


