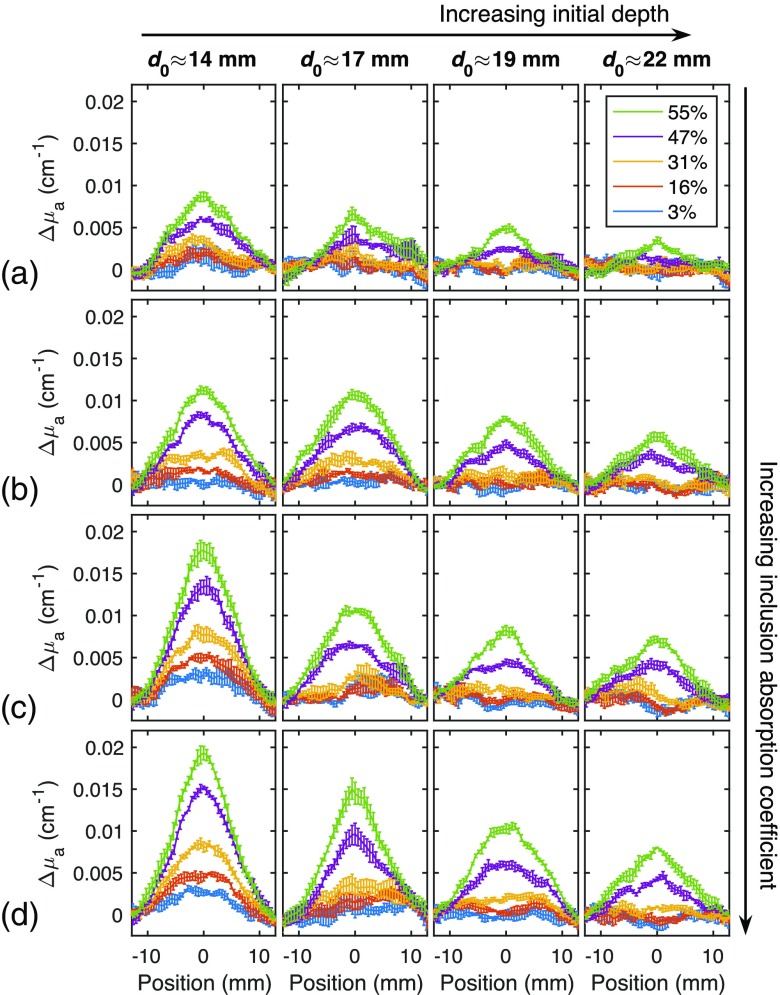
Fig. 3.
Absorption coefficient cross sections for each phantom, at five levels of compression, percent compression defined as change in phantom height divided by initial height. (a) , (b) , (c) , and (d) . The inclusion is positioned at the center of the cross section. As the absorption coefficient of the inclusion increases, the contrast measured with SFDI increases. Similarly, as the compression level increases, the effective inclusion depth decreases and the contrast increases as well.

