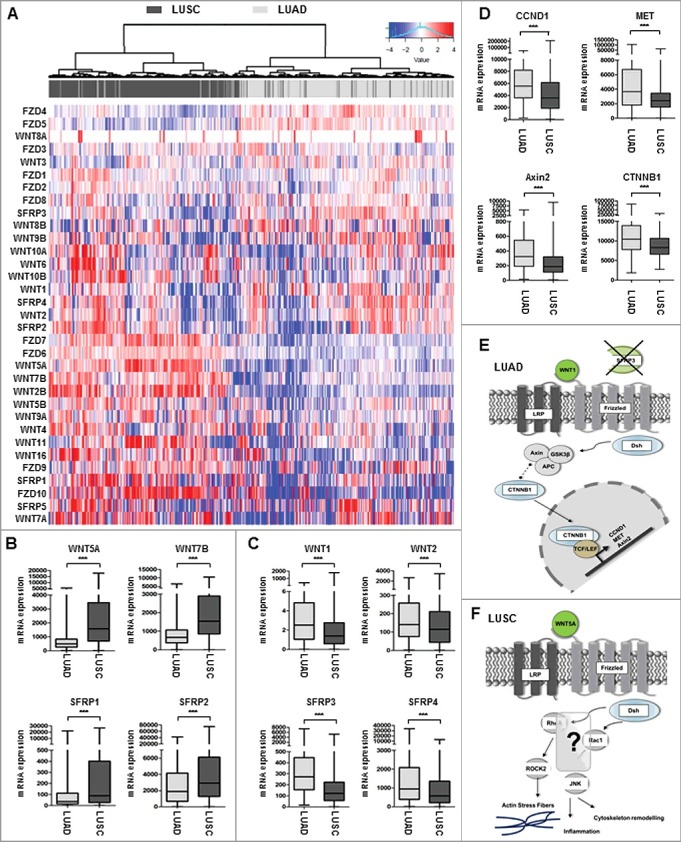
Figure 1.

Expression profile of WNT signaling components in adenocarcinoma and squamous cell carcinoma samples. (A-C) Heat map based on the TCGA IlluminaHiSeq mRNA expression platform illustrating the expression signature of WNT pathway genes, including tumor suppressor genes of the SFRP family, membrane receptors of the FZD family, and receptor ligands of the WNT family, clustered into adenocarcinoma subtype (top panel: dark grey) and squamous cell carcinoma subtype (top panel: light grey). Each row represents a specific gene and each column represents a patient sample. The color of each cell indicates the expression value of each gene in that sample: blue (low expression); red (high expression). (D) Box plot analysis of canonical WNT-target gene expression (CCND1, Met, Axin2, CTNNB1) in NSCLC samples subdivided into LUAD and LUSC showing increased canonical target gene expression in primary LUAD samples. Horizontal lines: grouped medians. Boxes: 25–75% quartiles. Vertical lines: range, peak, and minimum. ***P < 0.001. (E) and (F) Representative cartoons of the underlying WNT signaling pathway in LUAD and LUSC based on the expression profile of WNT components and canonical target genes. While a predominant role of canonical WNT signaling might be assumed in LUAD, LUSC were not clearly associated with neither canonical nor non-canonical WNT pathway.
