
Figure 3.
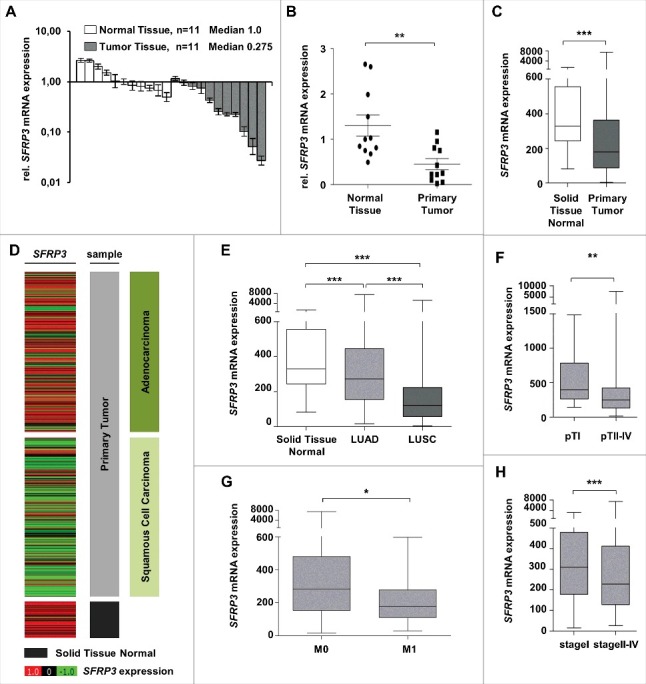
SFRP3 mRNA expression is lost in primary squamous cell carcinoma and reduced in advanced adenocarcinoma tissue samples. (A) SFRP3 mRNA expression is strongly reduced in NSCLC tissue samples (n = 11, median 0.275) in comparison to normal lung tissue (n = 11, median 1.00). (B) Scatter plot analysis represents reduced SFRP3 mRNA expression in primary lung tumor compared to normal lung tissue. Horizontal lines: grouped mean value. Vertical lines: SEM. **P < 0.01. (C) Box plot analysis based on the TCGA IlluminaHiSeq mRNA dataset showing reduced SFRP3 mRNA expression in primary lung tumor compared to normal lung tissue. Horizontal lines: grouped mean value. Vertical lines: SEM. ***P < 0.001. (D) and (E) SFRP3 mRNA expression is strongly reduced in squamous cell carcinoma and slightly reduced in adenocarcinoma compared with normal lung tissue. Tumor samples (based on TCGA IlluminaHiSeq) are split into adenocarcinoma (dark green, n = 518), squamous cell carcinoma (light green, n = 498), and normal tissue samples (gray, n = 205) (left panel). The relative SFRP3 mRNA expression values are illustrated in red (high expression) and green (low expression). (F) Box plot analysis of SFRP3 mRNA expression in adenocarcinoma subdivided into pT status shows decreased SFRP3 gene expression in pT2-4 compared to pT1. Horizontal lines: grouped medians. Boxes: 25–75% quartiles. Vertical lines: range, peak, and minimum. ***P < 0.001. (G) Box plot analysis shows decreased SFRP3 mRNA expression in metastatic adenocarcinoma tissue samples compared to non-metastatic adenocarcinoma tissues. Horizontal lines: grouped medians. Boxes: 25–75% quartiles. Vertical lines: range, peak, and minimum. *P < 0.05 (H) Box plot analysis illustrates reduced expression of SFRP3 in stage II and stage IV adenocarcinoma tissue samples compared with stage I. Horizontal lines: grouped medians. Boxes: 25–75% quartiles. Vertical lines: range, peak, and minimum. *P < 0.05