Figure 4.

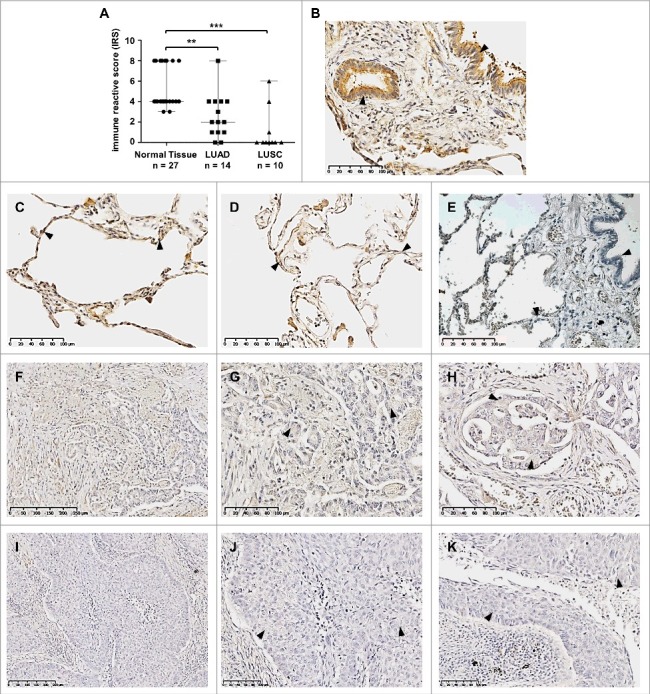
Loss of SFRP3 protein expression in human squamous cell carcinoma and adenocarcinoma of the lung. (A) Scatter plot analysis represents reduced SFRP3 immunoreactivity in primary LUAD samples (median: 2) and loss of SFRP3 protein in LUSC tissue (median: 0) compared to normal lung tissue (median: 4). Horizontal lines: median value. Vertical lines: probe ranges. **P < 0.01 ***P < 0.001 (B) Clear positive immunoreactivity in ciliated bronchial epithelium. (C and D) Strong SFRP3 protein staining in normal lung tissue, especially in type I and II pneumocytes of alveolar walls. (E) Negative control of normal lung tissue. Primary antibody was omitted. (F to H) Low SFRP3 immunoreactivity in the cytoplasm of advanced adenocarcinoma of the lung, indicating an IRS of 2 (F and G) and an IRS of 4 (H). (I to K) Loss of SFRP3 staining in the cytoplasm of primary squamous cell carcinoma samples, IRS of 0.
