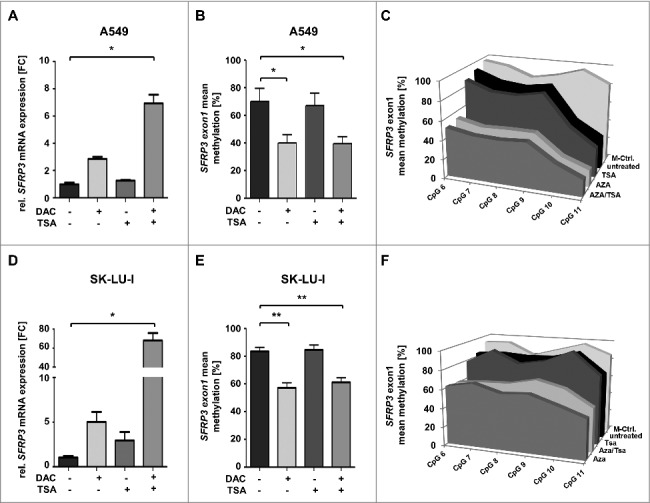
Figure 7.

SFRP3 mRNA re-expression after in vitro demethylation of adenocarcinoma cell lines A549 and SK-LU-I. (A) Semiquantitative real-time PCR showing SFRP3 mRNA expression without and after treatment with 5-aza-2’-deoxycytidine (DAC) and Trichostatin A (TSA) in the adenocarcinoma cell line A549. Increased SFRP3 mRNA expression is shown as fold-change relative to untreated A549 control cells. (B) and (C) Quantitative SFRP3 exon1 methylation was analyzed by pyrosequencing of six CpG duplets in A549 cells without and after DAC and TSA treatment. Area charts visualize mean methylation for each CpG of untreated, DAC, TSA, and DAC/TSA treated cells. (D) Semi quantitative real-time PCR showing SFRP3 mRNA expression without and after treatment with DAC and TSA in the adenocarcinoma cell line SK-LU-1. Increased SFRP3 mRNA expression is demonstrated as fold-change relative to untreated control cells. (E) and (F) Quantitative SFRP3 exon1 methylation was analyzed by pyrosequencing of six CpG duplets in SK-LU-1 cells without and after treatment with DAC and TSA. Area charts visualize mean methylation for each CpG relative to the respective treatment of SK-LU-1 cells.
