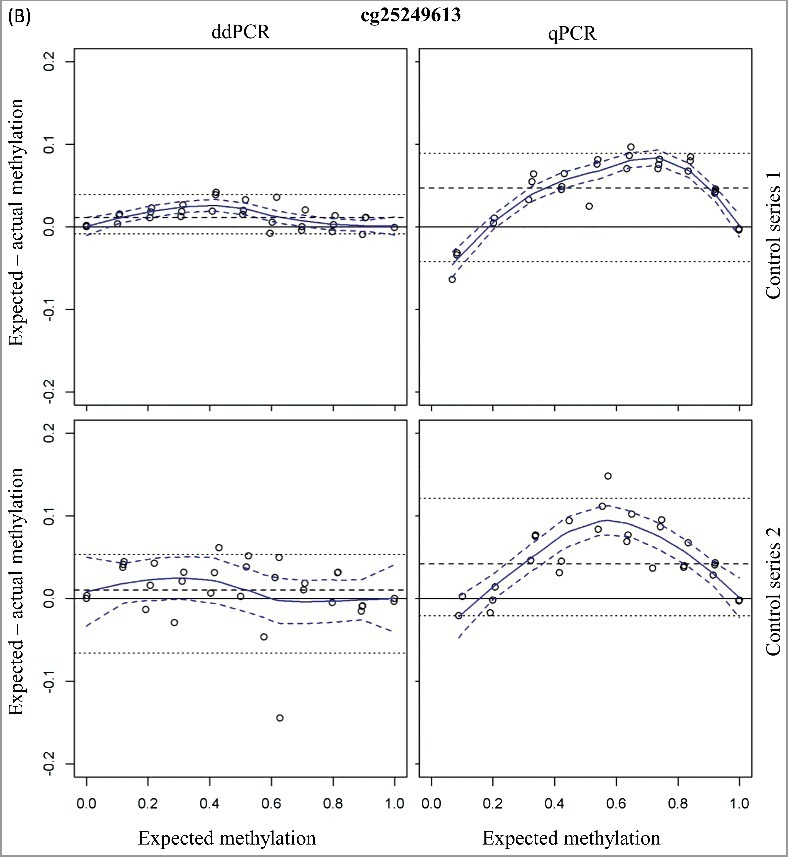
Figure 1.
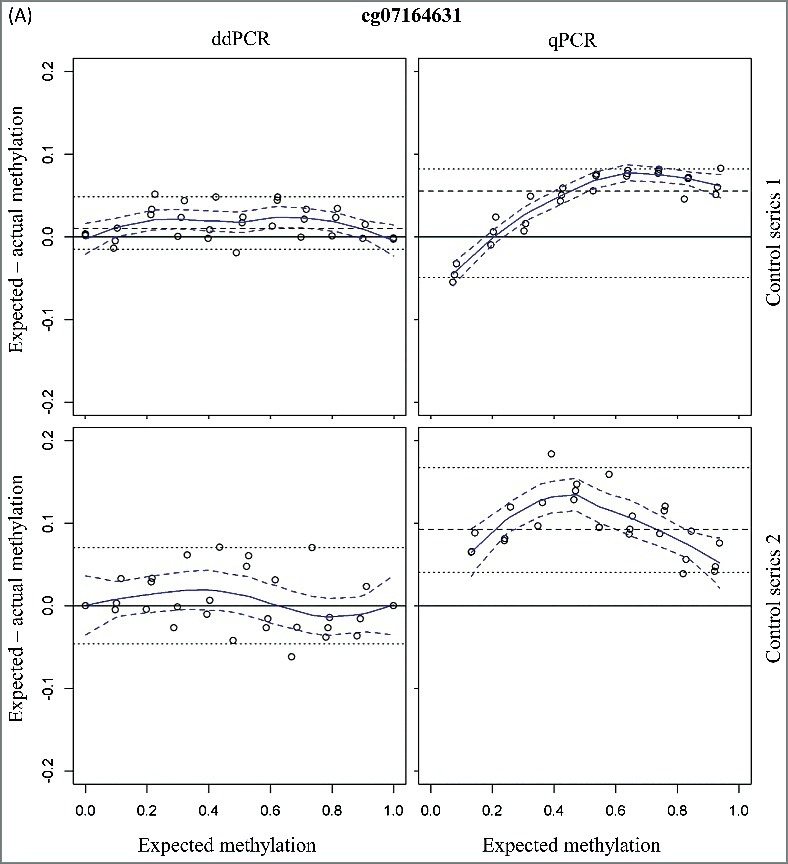
Bland-Altman plots for assessment of accuracy of the two CpG sites cg07164631 (A) and cg25249613 (B) using ddPCR and qPCR. The difference in measured and expected percentage methylation (y-axis) is plotted against the expected percentage methylation of the dilution series (x-axis). Two series of mixtures with methylated and unmethylated DNA controls were analyzed. The upper figures (control series 1) have a 5-fold higher DNA input. Dashed line = median; dotted lines = 2.5th and 97.5th percentile; curved blue solid line = Loess; dashed blue delimit 95% confidence band around Loess.