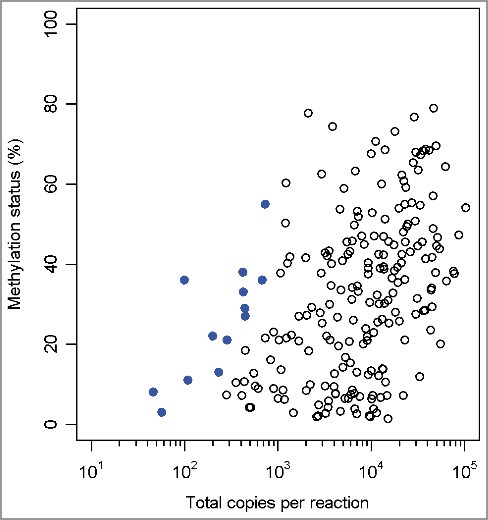
Figure 3.

Methylation status of cg07164631 and cg25249613 across 108 clinical FFPE samples by ddPCR. Scatterplot with percentage methylation (y-axis) vs. total copies per reaction (x-axis). The data points with a 95% CI >10% methylation status units are indicated in bold.
