
Figure 4.
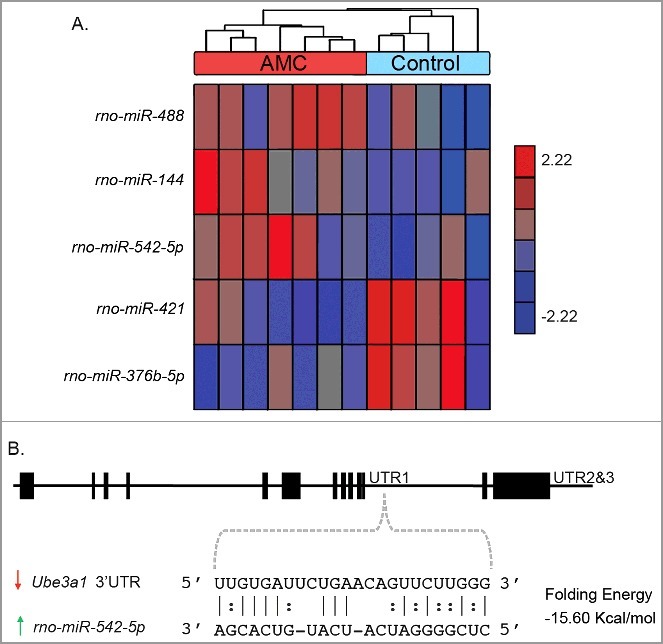
Differences in miRNA expression between AMC (n = 7) and control (n = 5) PND9 hypothalami. (A) Hierarchal clustering analysis of significant (P < 0.05) differential miRNA expression between. The expression of each gene was normalized to a mean of 0 and a standard deviation of 1. The values range from -2.22 to 2.22. Downregulated genes with AMC have negative values (blue), genes with no change have a value of zero (grey), and upregulated genes with AMC have a positive value (red). (B) Base-pairing of the predicted relationship between rno-mir-542-5p and the Ube3a1 3’UTR.