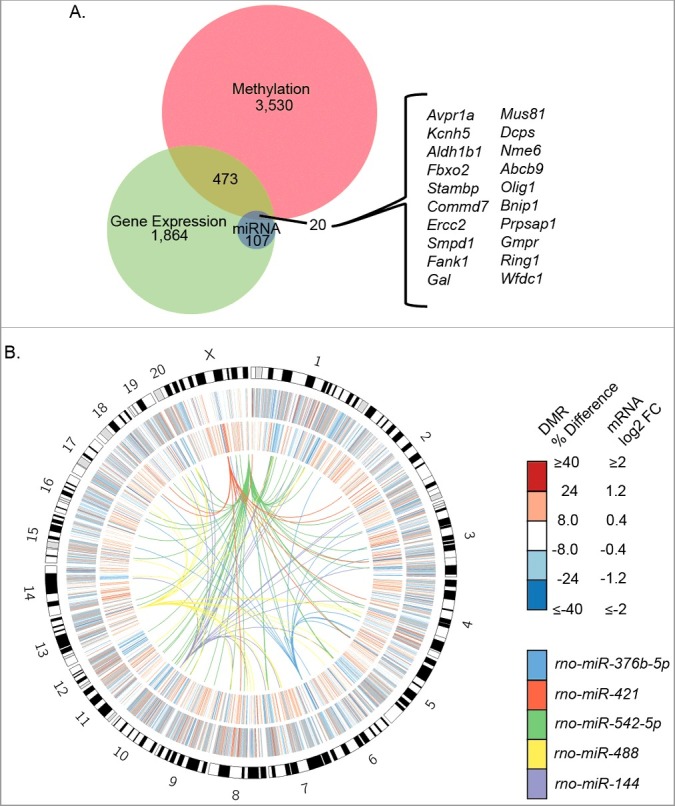
Figure 5.

AMC is associated with genome-wide differences in DNA methylation and gene expression. (A) Integration of DMR, RNA-seq, and miRNA analyses yields 20 prioritized genes (inset). (B) Circos plot of the different data sets. The outer heatmap represents the percent differences in methylation of DMRs, the inner heatmap represents the log2 fold change of DE transcripts, and the links represent miRNAs and their predicted target genes.
