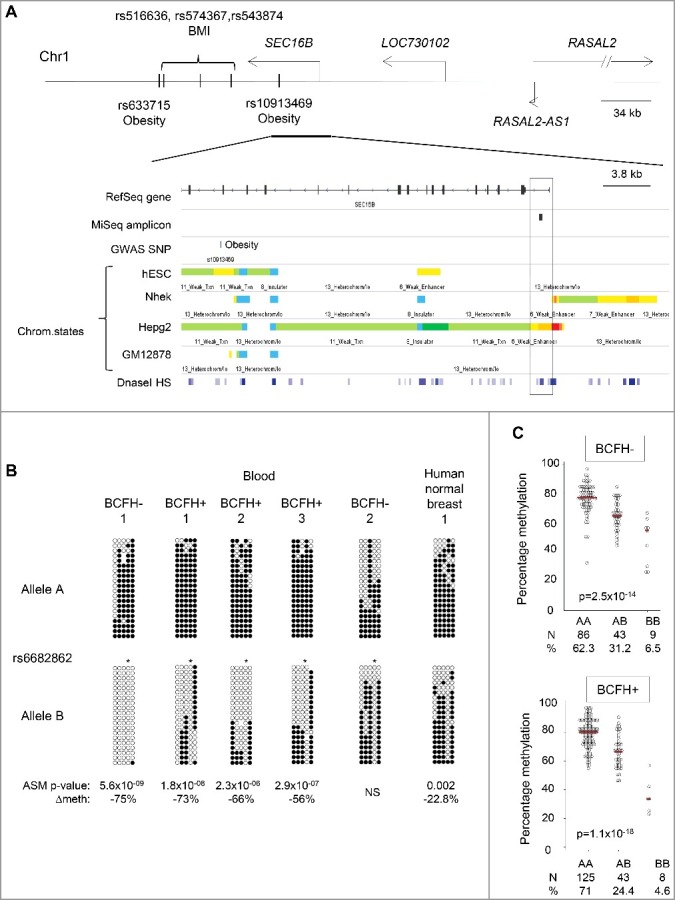
Figure 3.

Hap-ASM BCFH-DMR and mQTLs in the promoter of SEC16B. Map and results of bis-seq showing the BCFH-DMR and hap-ASM in the promoter of SEC16B. (A) Map of SEC16B, showing relevant ENCODE tracks and the amplicons utilized for targeted bis-seq. (B) Bis-seq data showing hap-ASM in the SEC16B promoter region. Graphical representation of 5 representative whole-blood samples and 1 human normal breast tissue. Additional representations in breast tissues and T cells from peripheral blood are shown in the Supplemental figure 1. This region overlaps with the common SNP, rs6682862. Allele A and B are analyzed and represented separately. The SNP dictates methylation level with the alternate allele (allele B) being significantly hypomethylated compared to the reference allele (allele A), suggesting the presence of hap-ASM in 25 out of 32 heterozygous samples. The low methylated allele is significantly biased toward allele B (P = 3 × 10−08, using binomial test), which ruled out imprinting. For each heterozygous sample, Wilcoxon P value and methylation difference between alleles were calculated by bootstrapping (1,000 sampling of 50 reads per allele) and are indicated only for significant hap-ASM defined as difference in percentage methylation >20%, >3 ASM CpGs, and P < 0.05. One representative random sample of each allele (20 reads per allele) is shown. ∆Meth (difference in percentage of methylation between alleles in heterozygous samples) and Wilcoxon P values are from bootstrapping. * indicates the position of the index SNP which overlap with a CpG site, which is, therefore, always unmethylated on allele B. (C) CpG methylation values (percent) by genotypes in BCFH- girls (Up) and BCFH+ girls (Bottom). The red line represents the median methylation. Methylation and genotype significantly correlate in both groups supporting mQTL/hap-ASM. Girls with the AA genotype had the highest methylation levels, while girls with BB genotype had lowest methylation levels. The number of samples for each genotype and the distribution (%) is indicated below each graph.
