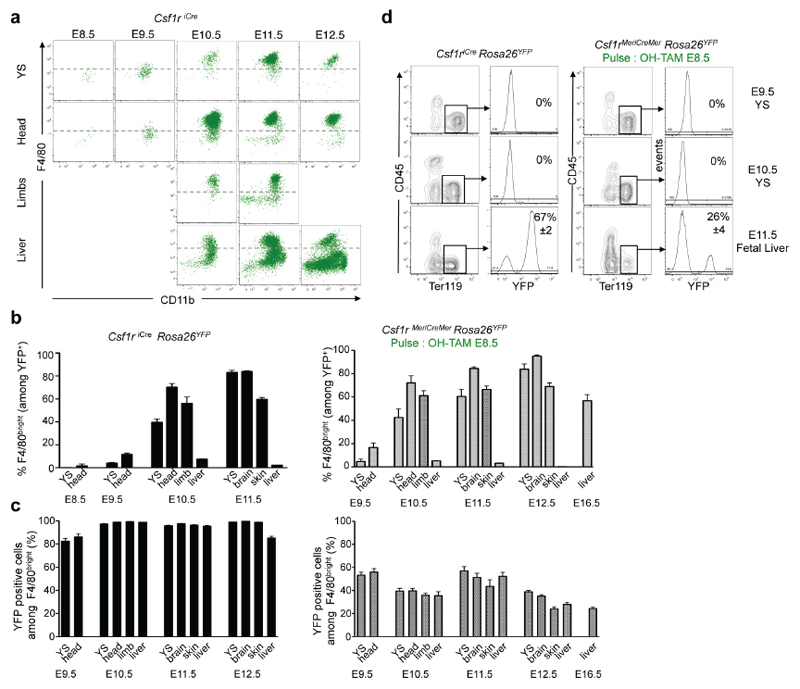
Extended Data Figure 4. Analysis of Csf1r reporter expression in fetal macrophages and red blood cells in Csf1riCre Rosa26YFP.
a, F4/80 and CD11b expression on YFP+ CD45+ from YS, head (brain for E11.5), limbs and liver of Csf1riCre Rosa26YFP embryos (E8.5, n=4; E9.5, n=16; E10.5, n=5; E11.5, n=9; E12.5, n=5). Dashed line represent FMO (fluorescence minus one) control. b, Percentage of macrophages (F4/80bright) among YFP+ cells, mean±s.e.m., in Csf1riCre Rosa26YFP embryos (left) and Csf1rMeriCreMer Rosa26YFP embryos pulsed with OH-TAM at E8.5 (right). See also Extended Data Table 1. c, Percentage of YFP+ cells among F4/80bright cells (YFP labelling efficiency) per embryonic organ/region and developmental time points (mean±s.e.m.). Left panel, Csf1riCre Rosa26YFP embryos (E8.25, n=7; E8.5, n=5; E9.5, n=15; E10.25, n=9; E10.5, n=5; E11.5, n=9; E12.5, n=5); right panel: Csf1rMeriCreMer Rosa26YFP embryos pulsed at E8.5 (E9.5, n=3; E10.25, n=3; E10.5, n=4; E11.25, n=4; E12.5, n=9). d, YFP expression in erythrocytes (CD45- Ter119+) from YS and fetal liver of Csf1riCre Rosa26YFP embryos (left) and Csf1rMeriCreMer Rosa26YFP embryos pulsed with OH-TAM at E8.5 (right).

